Figure 1.
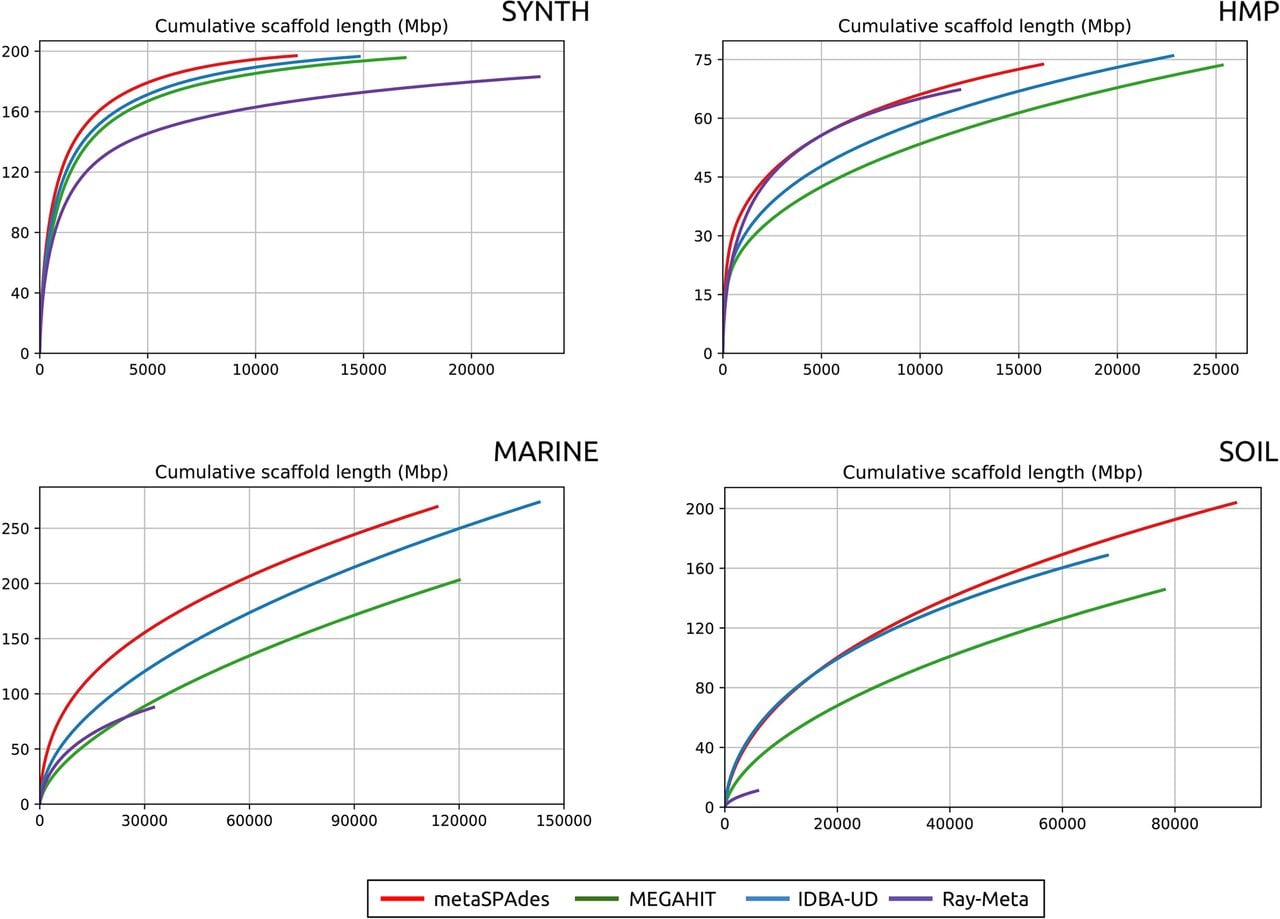
The cumulative scaffold lengths plots. On the x-axis, scaffolds are ordered from the longest to the shortest. The y-axis shows the total length of x longest scaffolds in the assembly.
The cumulative scaffold lengths plots. On the x-axis, scaffolds are ordered from the longest to the shortest. The y-axis shows the total length of x longest scaffolds in the assembly.