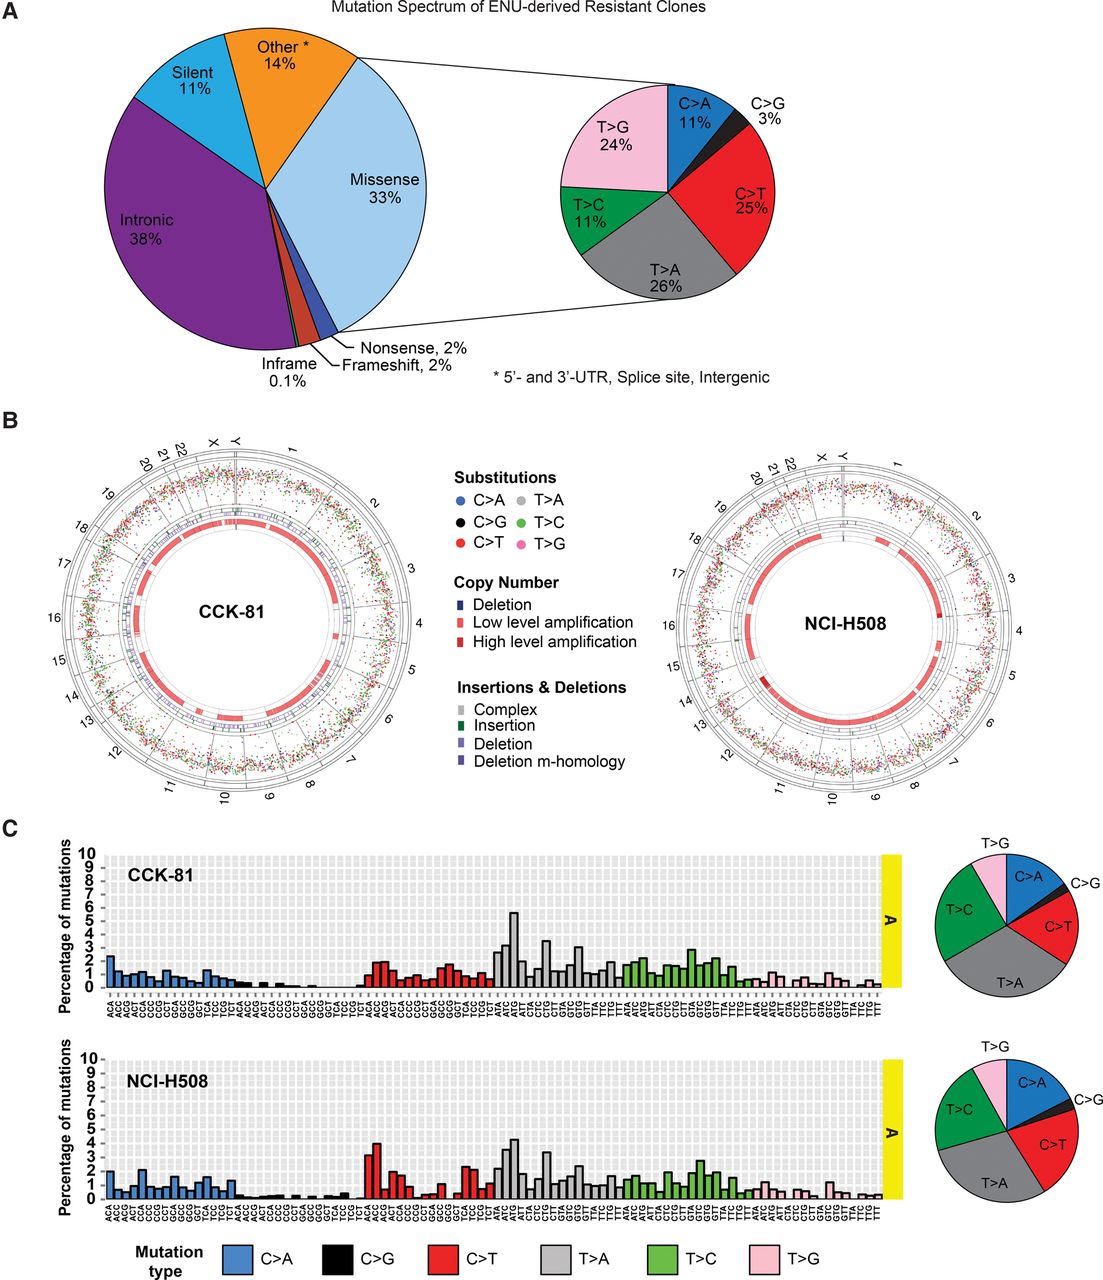
The spectrum of ENU-induced mutations. (A) Spectrum of mutations in ENU-derived drug-resistant clones. A pie chart representation of the proportion of 33,857 mutations detected in CCK-81 and NCI-H508 clones categorized according to mutation type. For the missense mutations, there is a further representation of the proportion of mutations falling within the six possible nucleotide base substitutions (C > A, C > G, C > T, T > A, T > C, T > G). (B) Circos plots of mutations in CCK-81 and NCI-H508 clones. All substitution mutations in CCK-81 or NCI-H508 clones are represented by their intermutation distance per chromosome. Each chromosome is composed of all coding exons in genes found within that chromosome. The four circles in each plot, from outermost inward, represent the human chromosomes, substitution mutations, insertion mutations, deletion mutations, copy number gains, and copy number losses. Low- and high-level amplification refers to 2–4 and 4–8 copies, respectively. (C) The mutational signature of ENU. The trinucleotide representation of ENU mutations in CCK-81 and NCI-H508 drug-resistant colonies is displayed as the distribution of mutations for all 96 possible combinations of mutations generated as a result of ENU exposure. Adjacent pie charts display the relative distribution of each of the six classes of possible base substitutions for the CCK-81 and NCI-H508 clones.