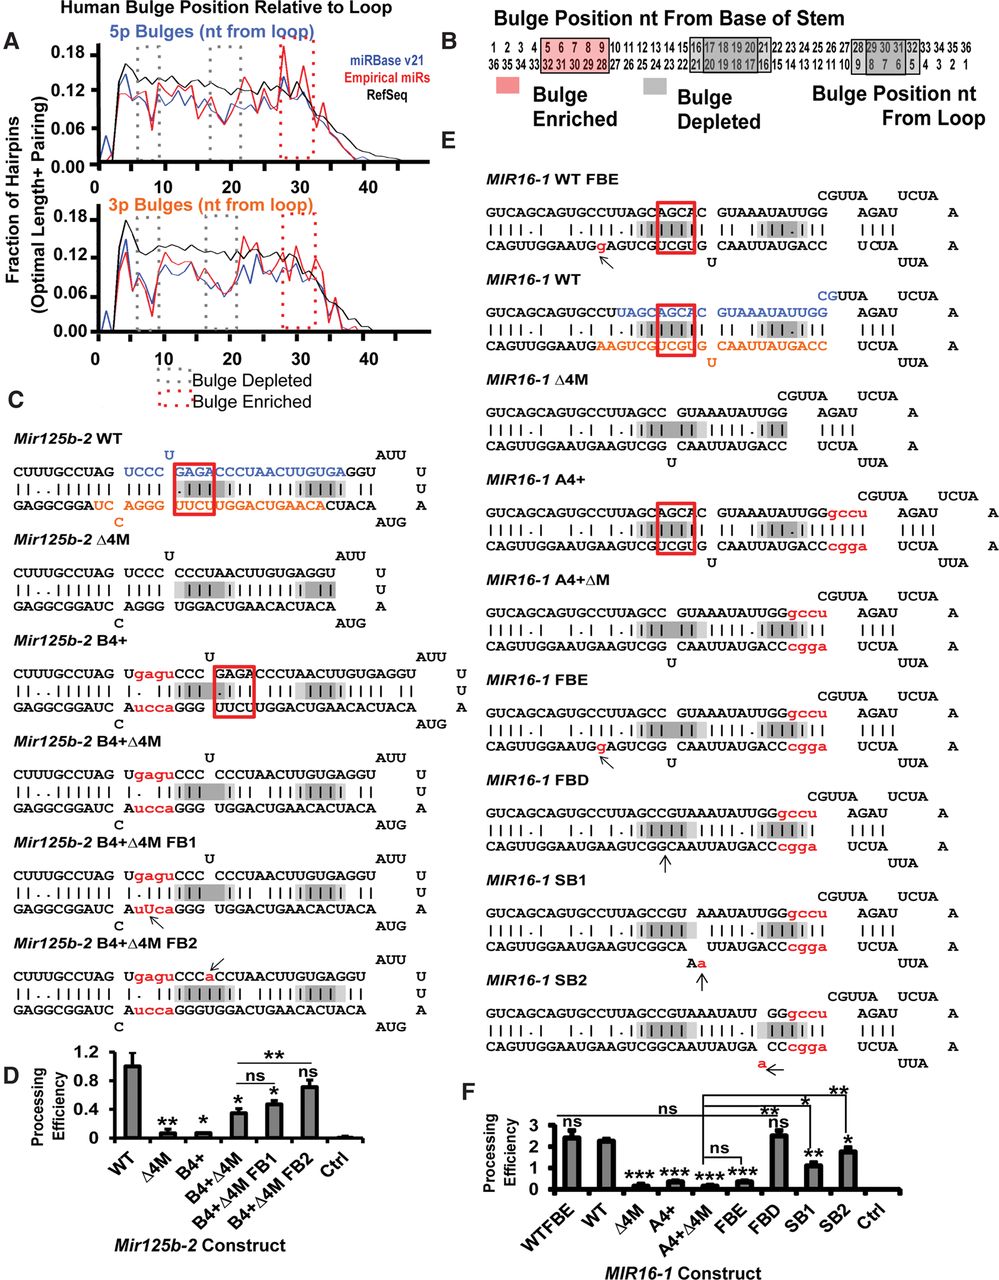
The roles of the bulge-depleted regions in pri-miRNA processing. (A) The distributions of bulges along hairpin stem were plotted with distance measured from the junction between apical loop and the stem in nucleotides, for human miRBase v21 hairpins, Empirical miRNA hairpins, or RefSeq hairpins. Hairpins were preselected to have optimal length (33–39 nt) and pairing (≥82%). Bulge distributions along the 5p arm (top) or 3p arm (bottom) of the hairpin were plotted. The bulge-depleted and bulge-enriched regions were indicated with dashed boxes. (B) A diagram for bulge-depleted and bulge-enriched regions was illustrated for hairpins with a stem length of 36 nt. The numbers indicate position from the base of the stem (left side) or apical/stem junction (right side). The bulge-enriched region was depicted with a pink box, whereas bulge-depleted regions were depicted with gray boxes, with the edge of the depleted regions in lighter gray to reflect less depletion. (C) Hairpin structures for WT or mutant mouse Mir125b-2 hairpins are illustrated. Color-coded elements include 5p mature miRNA (blue), 3p miRNA (orange), insertions (red letters; lowercase), and deletions that occurred in other related constructs (red box). Watson-Crick pairings are indicated with vertical bars, whereas G:U pairings are indicated with dots. The positions of the bulge-depleted regions, as measured from the base of the stem, are shaded in gray. (D) The constructs in C were subjected to the processing reporter assay in BaF3 cells, with data normalized and the levels of WT mouse Mir125b-2 set to one and an empty vector (Ctrl) set to zero. N = 3. (E) Hairpin structures for WT or mutant MIR16-1 are depicted, with the same color-coding system as in C. Arrows point to nucleotide alterations. (F) The constructs in E were subjected to the processing reporter assay in BaF3 cells, with data normalized and the levels of WT mouse Mir125b-2 set to one and an empty vector (Ctrl) set to zero. N = 3. Error bars, SD. P-values are annotated above the bars for comparison with WT construct. Other P-value comparisons are indicated with horizontal bars. (*) P < 0.05; (**) P < 0.01; (***) P < 0.001; (ns) not significant.