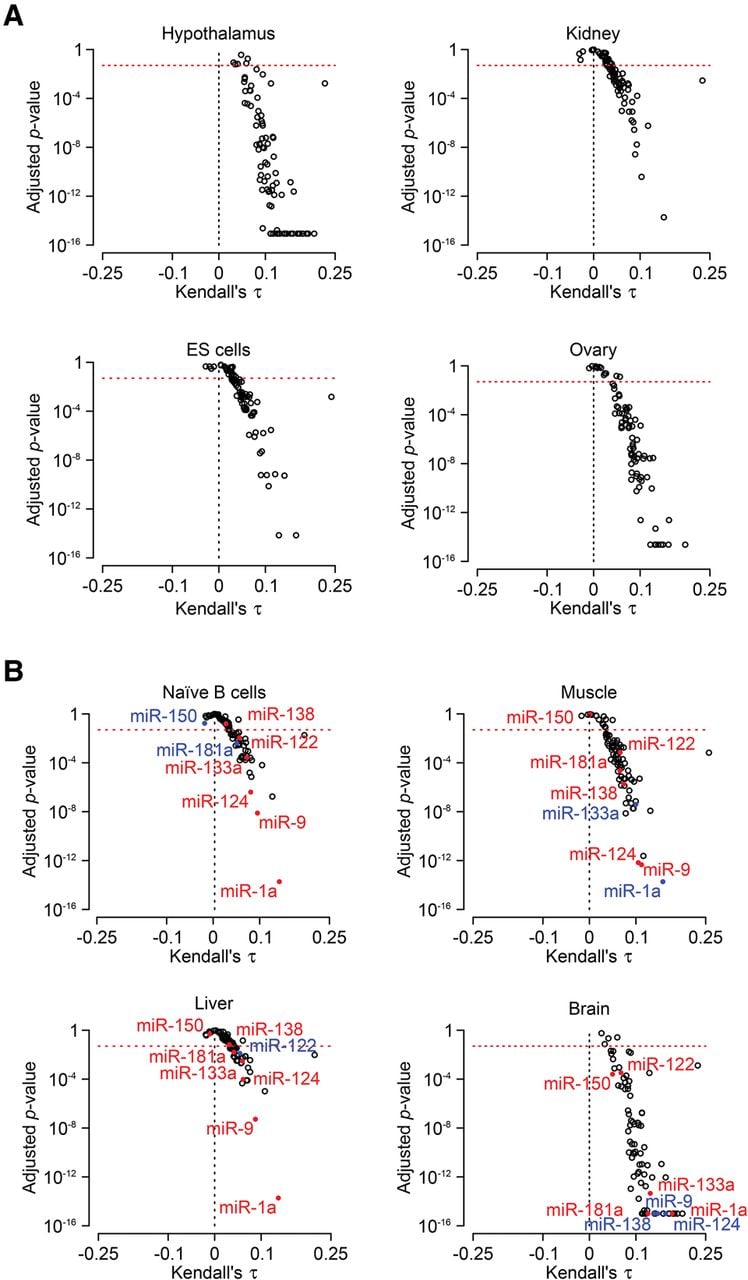
The most highly expressed genes tend to bear the most highly conserved miRNA binding sites. (A) Volcano plots represent correlation coefficients between microarray signal and the aggregate probability of conserved targeting (PCT) for each mRNA (x-axis), and their p-values (y-axis). Each miRNA family is represented by a circle. p-values were adjusted using the Benjamini-Hochberg correction. The dotted red line indicates an adjusted p-value of 0.05 and the dotted black line indicates a correlation coefficient of zero. Adjusted p-values lower than 2.2 × 10⁻¹⁶ were set to 2.2 × 10⁻¹⁶ for graphical clarity. (B) Same conventions as in panel A, but miRNA families with highly specific expression patterns are colored (red: miRNA specific for another tissue than the one analyzed; blue: miRNA specific for the analyzed tissue).