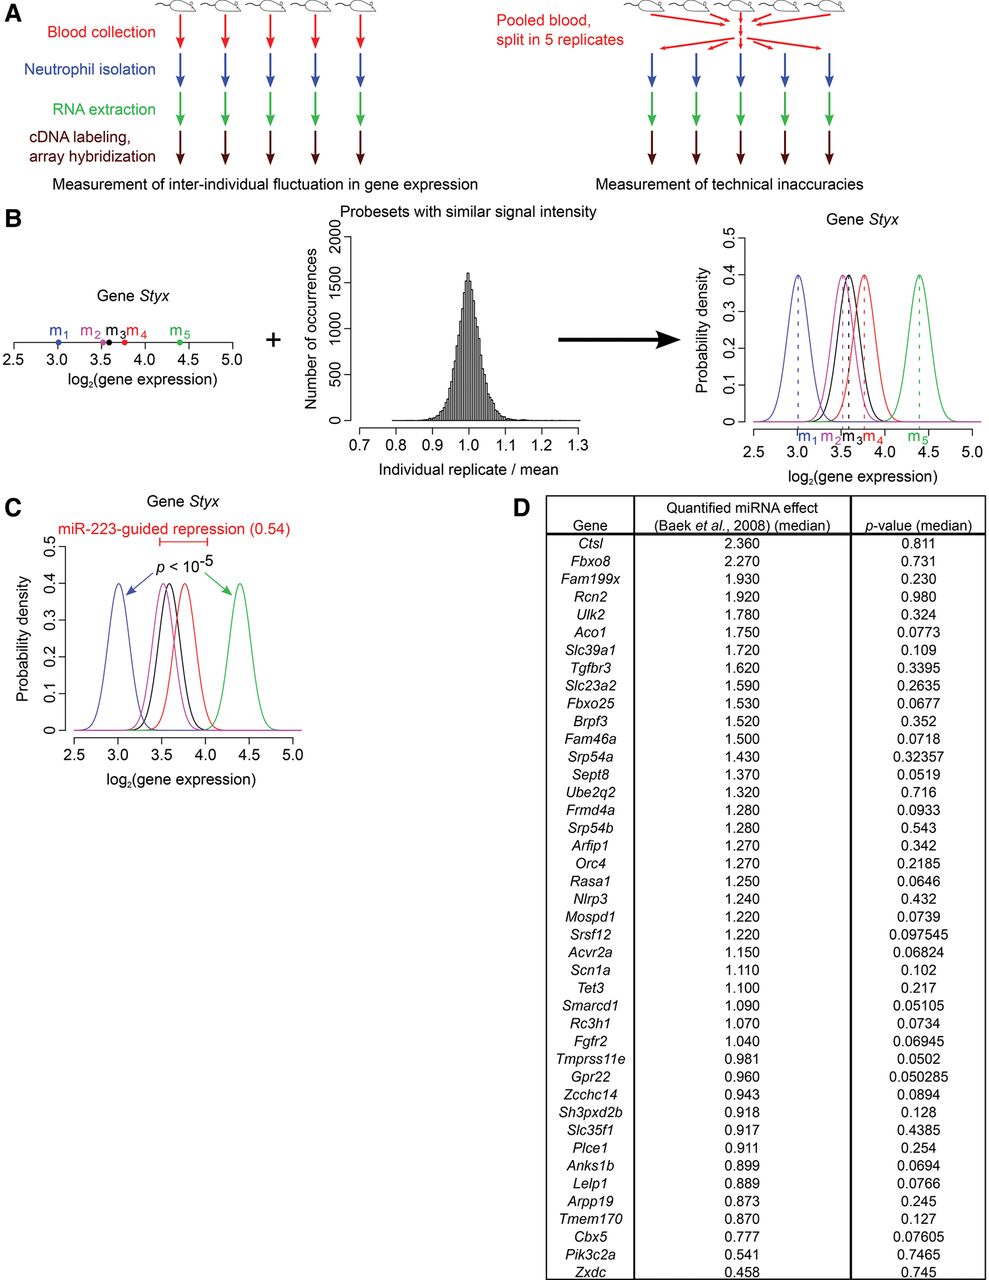
Inter-individual variability in miR-223 target expression is frequently larger than miR-223-guided repression. (A) Principle of the experiment. (B) The measured microarray signal is the sum of the underlying biological value and technical noise (here illustrated with the Styx gene). Measured signals (m1–m5) are deconvoluted using the measured technical variability (see Supplemental Experimental Procedures). (C) For each predicted miR-223 target, the amplitude of miR-223-guided repression is compared to the amplitude of gene expression variability across the five mice (here illustrated with the Styx gene). The p-value measures the probability that the underlying biological variability is smaller than miRNA-guided repression. We used the median repression value measured by Baek et al. (2008) (represented by the red horizontal bar) to estimate miR-223-guided repression. (D) Genes whose inter-individual fluctuations are not significantly larger than miR-223-guided repression (p ≥ 0.05). Middle column: fold-change due to miR-223-mediated repression according to data of Baek et al. (2008) (note that some genes have a fold-change < 1, thus appearing to be up-regulated by the miRNA: these genes may be indirectly affected by miR-223). Right column: p-value, measured as in panel C (median across all probe sets for that gene).