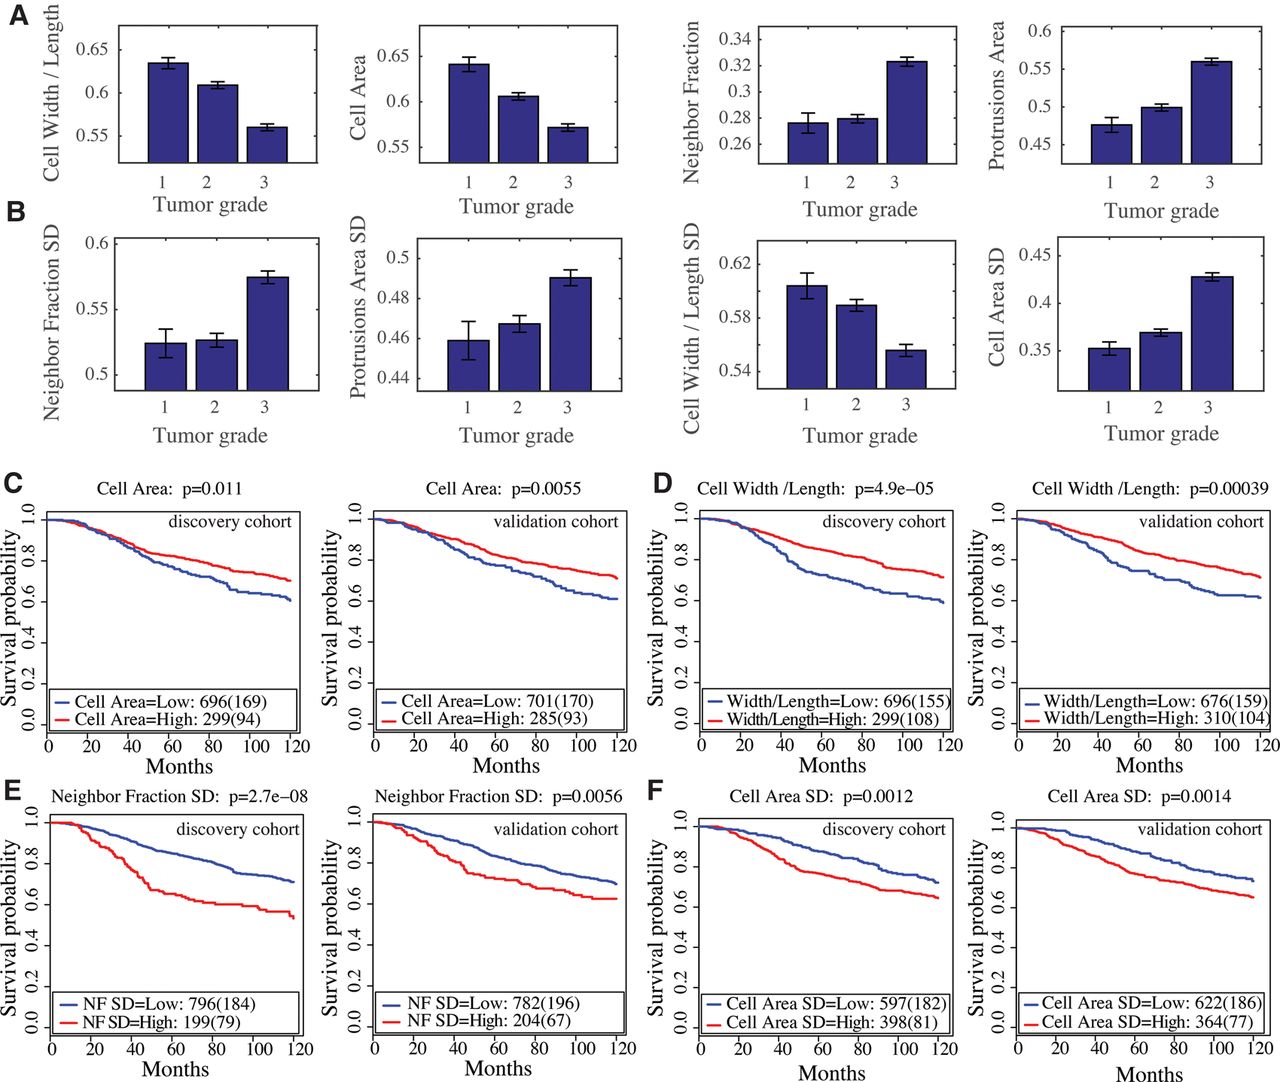
The prognostic value of the morphological metagenes and their associations with the clinical parameters in the METABRIC data set. (A) Association between tumor grade and cell W/L, cell area, NF, and protrusion area metagenes. All these associations are significant, with P-value < 0.0005 using the Jonckheere–Terpstra test. Error bars indicate the standard error of the mean (SEM). (B) Association between tumor grade and NF SD, protrusion area SD, cell W/L SD, and cell area SD metagenes. These associations are significant, with P-value < 0.0005 using the Jonckheere–Terpstra test. Error bars indicate the SEM. (C–F) Kaplan–Meier curves to illustrate the disease-specific survival probabilities of patient groups in discovery and validation cohorts in the METABRIC data set stratified by (C) cell area, (D) cell W/L, (E) NF SD, and (F) cell area SD metagenes.