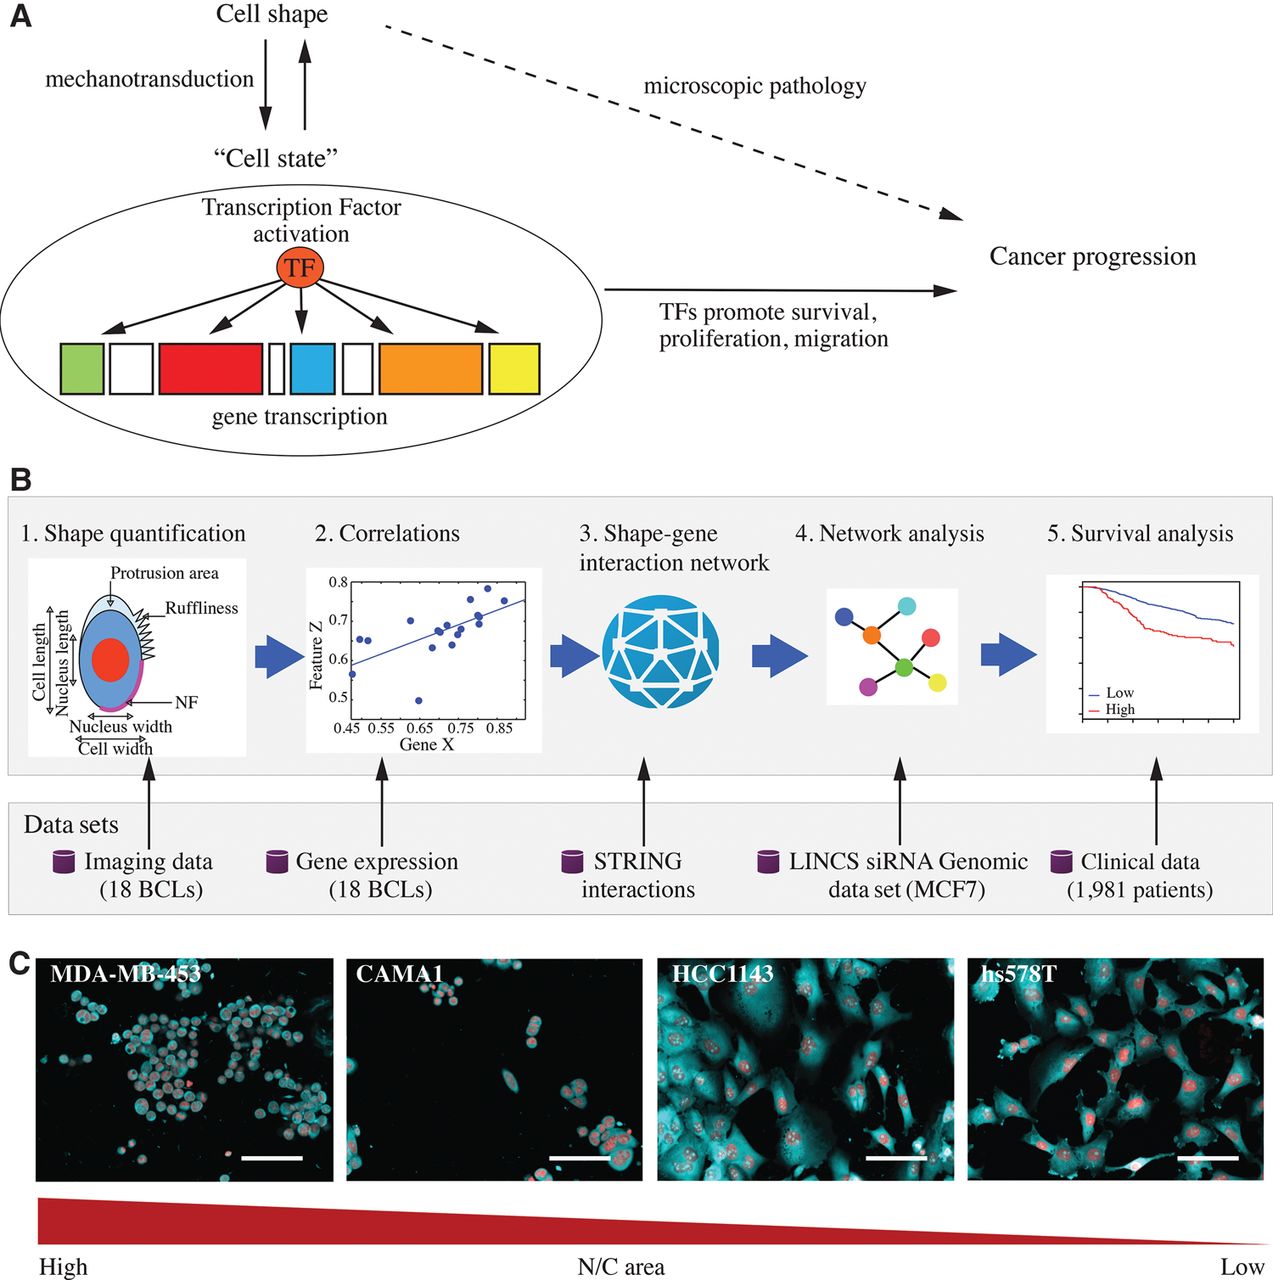
Figure 1.
Integrating imaging and expression data. (A) The three-way relationship between cell shape, signaling states, and cancer progression. (B) Workflow for linking cell shape to transcription and patient outcome. (C) Representative images of different breast cancer lines (BCLs) to illustrate the variation in nucleus/cell area ratio (N/C area) MDA-MB-453, CAMA1, hs578T, and HCC1143 cells, where cell lines to the left have the highest N/C area and cell lines to the right have the lowest N/C area. Red: DAPI, cyan: DHE. Scale bar = 30 µm.