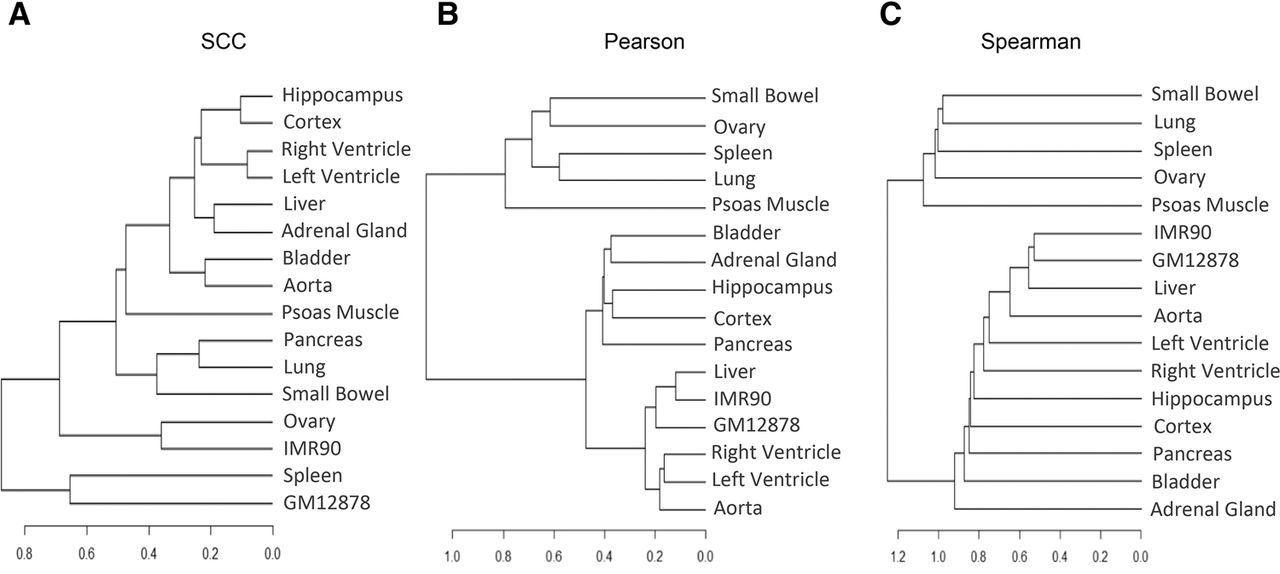
Figure 5.
Estimated interrelationship for 14 human primary tissues and two cell lines in Schmitt et al. (2016). The dendrograms result from a hierarchical clustering analysis based on the pairwise similarity calculated using SCC (A), Pearson correlation (B), and Spearman correlation (C).