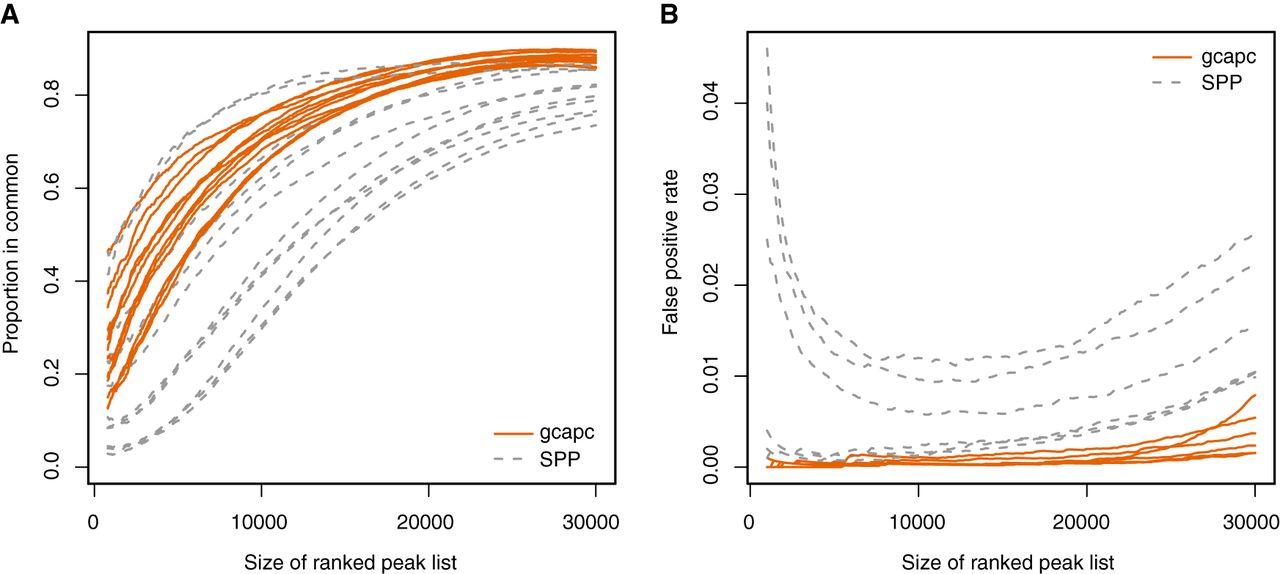
Improvements of peak calling consistency and transcription factor binding site enrichment with GC-content adjustment. For the CTCF HUVEC cell line, we create lists of candidate peaks and rank them based on enrichment score. (A) Correspondence at the top (CAT) plots. For each list size, we compute the proportion of peaks in common reported by two different laboratories. We do this for each pairwise comparison and plot this percentage against the list size. Peak width is scaled to the same median size between gcapc and SPP for each sample. (B) For each list size, we compute PWM scores for each peak and define with lower than 72% as false positives. We do this for each replicate and plot the false-positive rate against the list size and plot the number of false positives for each list size ranging from 1 to 30,000.