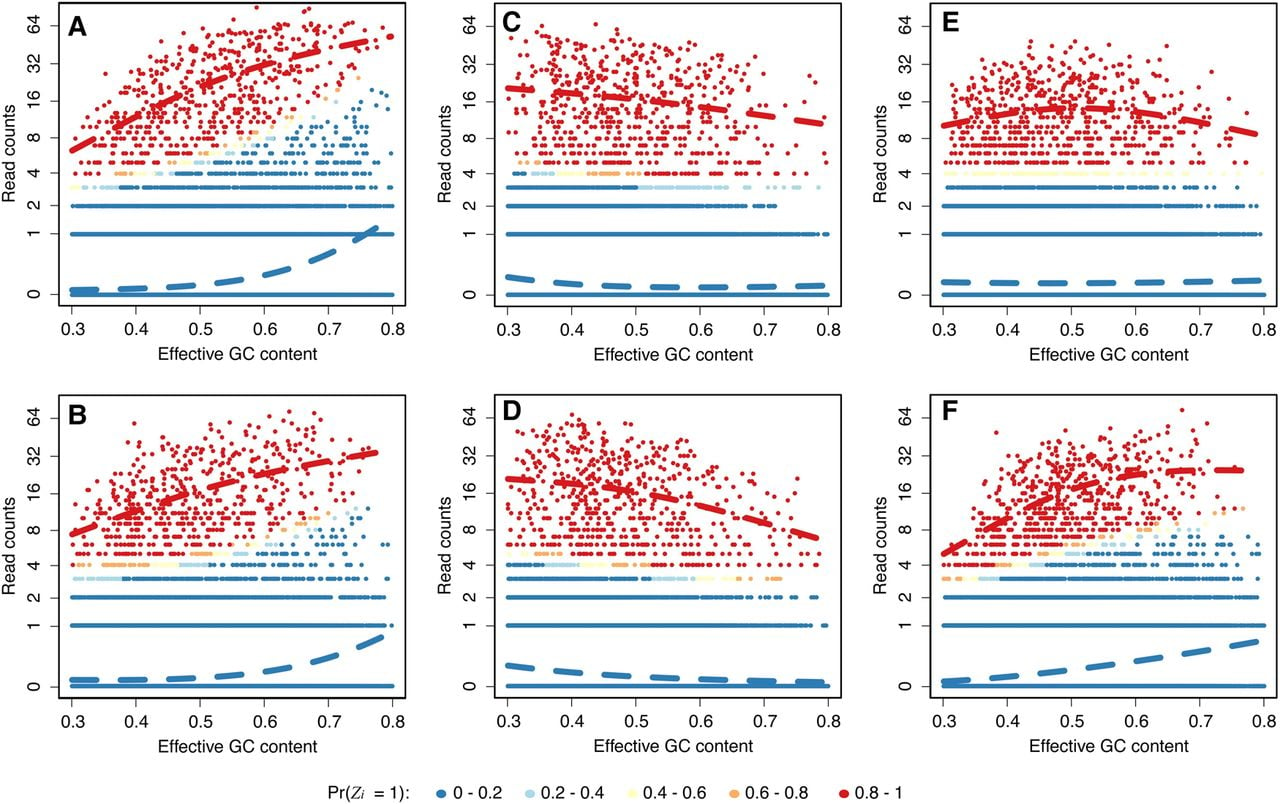
Figure 4.
Visualization of the fitted generalized linear mixture model. (A) We defined bins using estimated binding size (W in Fig. 3A) and randomly selected 5% of all genome-wide bins. We computed counts for these bins in the first replicate of the CTCF HUVEC cell line for laboratory UW. We fitted our model to these bins. The colors represent the probability of being background (blue) or signal (red). The GC-content bias smooth functions are plotted with dashed curves. (B) As in A but for the second replicate for laboratory UW. (C) As in A but for laboratory UTA. (D) As in C but for the second replicate for laboratory UTA. (E) As in A but for laboratory Broad. (F) As in E but for the second replicate for laboratory Broad.