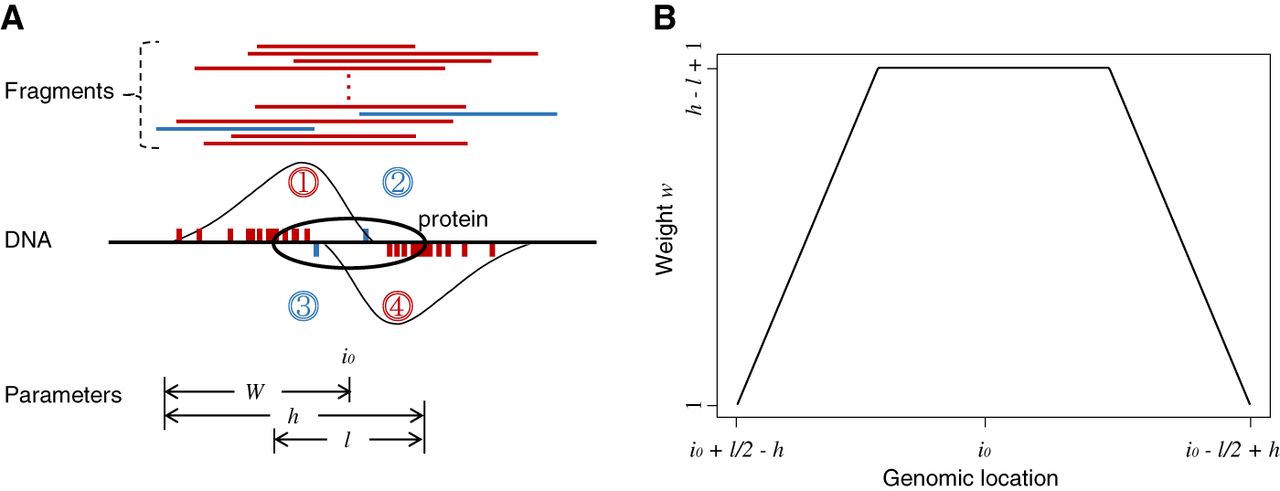
Illustration of regions related to the enrichment score and effective GC-content calculation. (A) The regions associated with the counts denoted by Yi,+, Yi,−, Bi,+, Bi,− in the paper are denoted with the regions 1, 4, 2, and 3, respectively. The red and blue lines represent fragments that are true signals and background noise, respectively, with their start positions labeled as bars on the DNA plot with corresponding colors. The start positions for forward strand fragments are labeled above the line while reverse strand fragments are labeled under the line. A cartoon indicating the signal coverages formed by forward and reverse strands is also added on the DNA plot. (B) Illustration of nucleotide weights when calculating effective GC content for a bin centered at location i0.