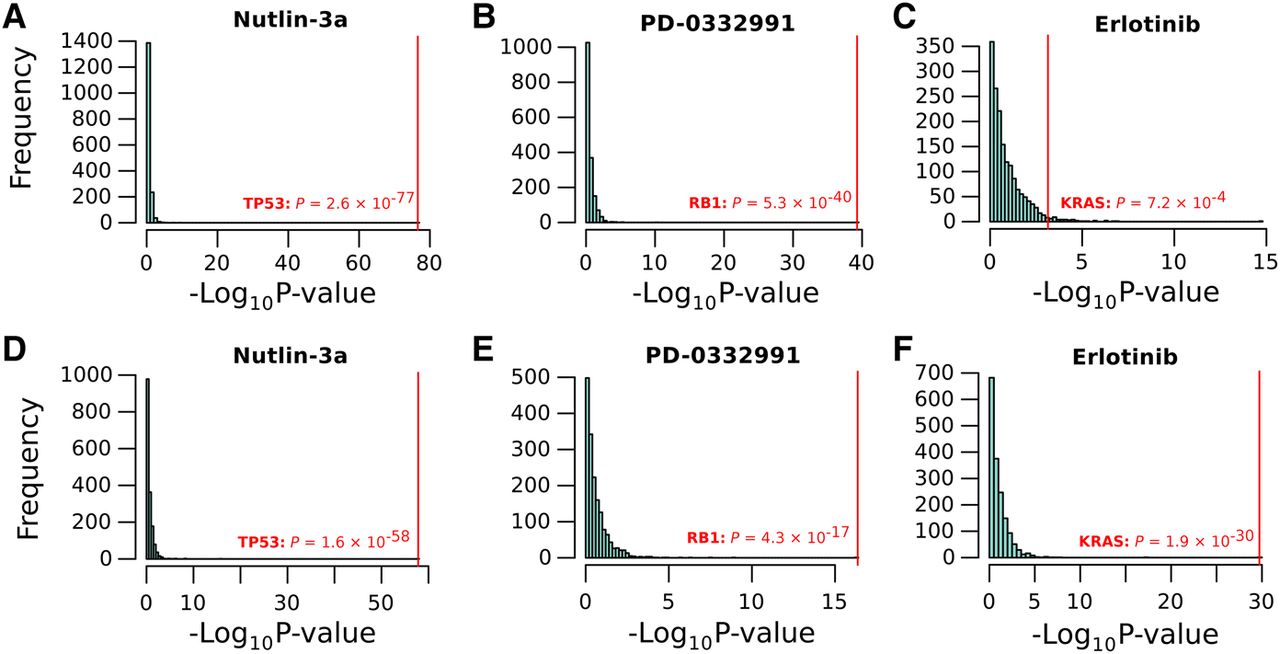
Figure 5.
Top gene–drug associations recovered across all of TCGA. Histograms showing the association between all genes with a somatic protein-coding change in at least 50 samples (n = 1739 genes) in TCGA and imputed drug response. (A–C) Associations when we control for cancer types; (D–F) associations when we control for GLDS, rather than cancer type. The canonical clinical target is highlighted in red; in all cases, the correct target is identified with a very high level of significance and specificity.