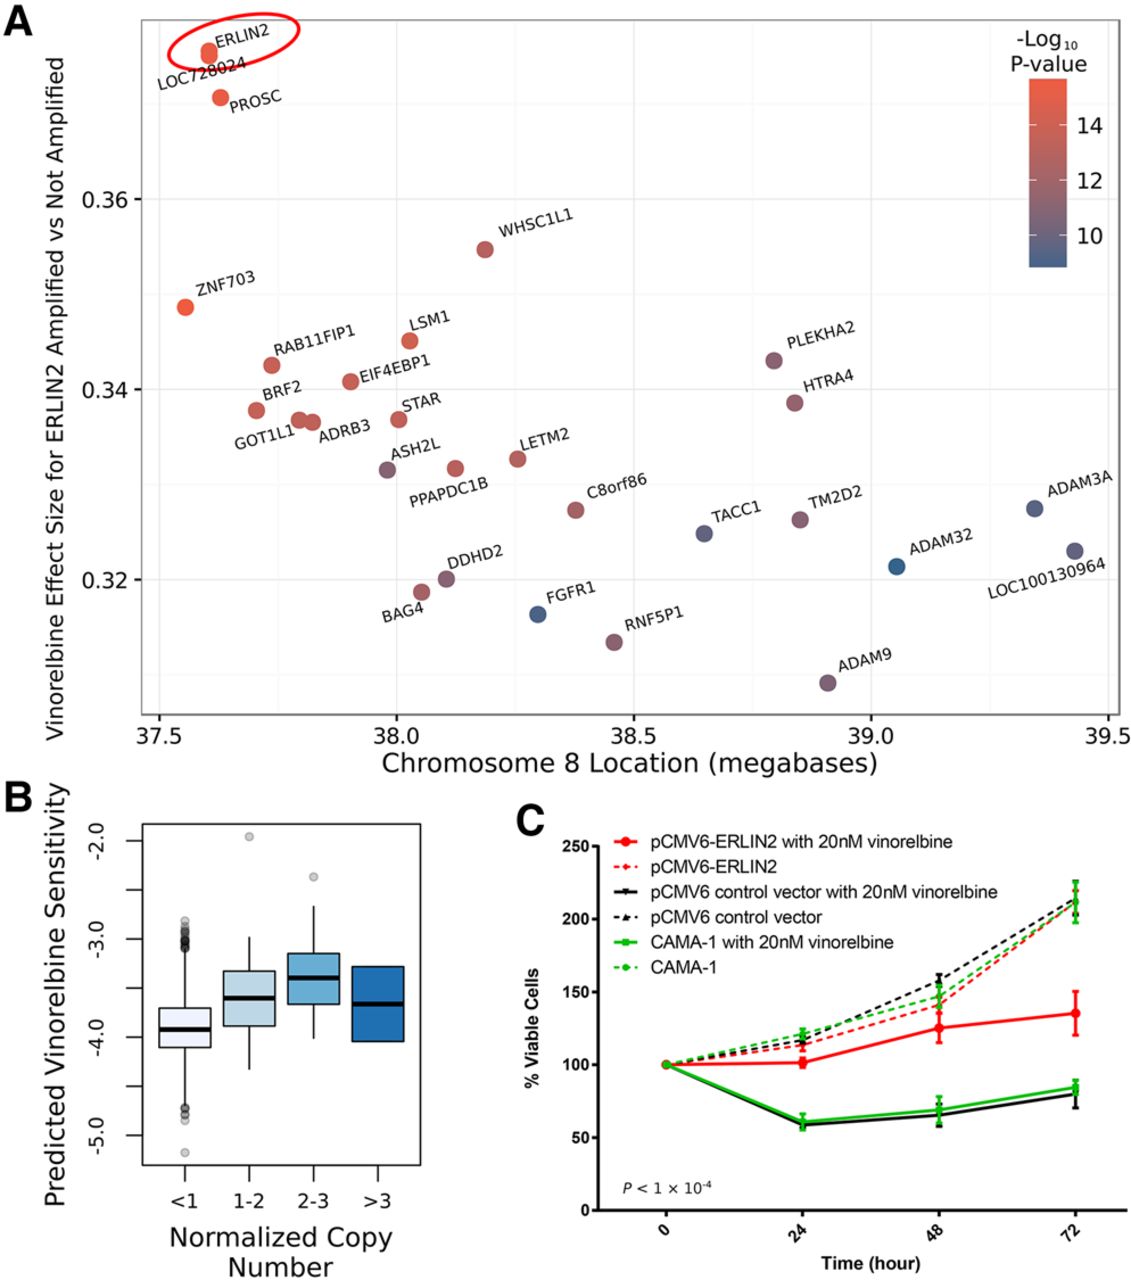
Copy number amplification of ERLIN2 causes vinorelbine resistance. (A) Each gene was tested for its association between CNA and vinorelbine response in the TCGA breast cancer cohort (n = 1089). The resulting effect size is plotted for each gene in Chr8p11.2. The biggest effect is for ERLIN2, suggesting that amplification of this gene may be causing resistance to vinorelbine. Higher values on the y-axis imply greater vinorelbine resistance in copy number–amplified samples. (B) Boxplot of association of ERLIN2 amplification and imputed vinorelbine response in TCGA. Note that the last box (n > 3) contains only two patients. (C) Percentage of viable CAMA-1 breast cancer cells treated with vinorelbine (solid lines) or untreated (broken lines). Viability is compared for ERLIN2-overexpressing cells (red), cells transfected with an empty plasmid (black), or untransfected cells (green). As predicted by IDWAS in the TCGA breast cancer patients, ERLIN2 overexpression causes vinorelbine resistance.