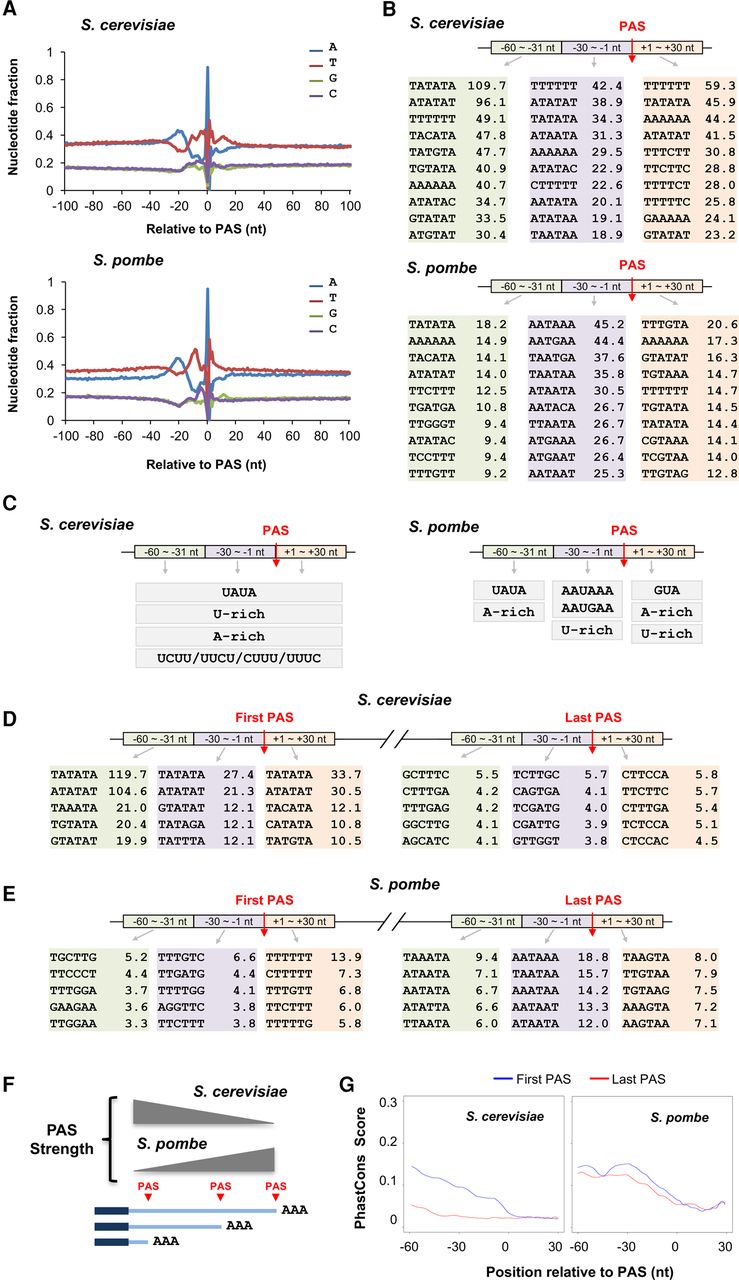
Sequence motifs around PASs. (A) Nucleotide frequencies around the PASs of S. cerevisiae (top) and S. pombe (bottom). (B) Enriched 6-mers around the PASs of S. cerevisiae (top) and S. pombe (bottom). Enrichment values are Z-scores (Methods). Three regions around the PAS were analyzed separately, as indicated. (C) Summary of significant motifs around the PASs of S. cerevisiae and S. pombe based on 6-mer (B) and 4-mer (Supplemental Fig. S2) results. (D) Enriched 6-mers around the first and last 3′ UTR PASs of genes in S. cerevisiae. Values are −log10(P), where P is based on the Fisher's exact test comparing first and last PAS sets. (E) As in D, except that S. pombe data are shown. (F) Summary of PAS strength versus location based on motif analyses. (G) PhastCons scores of the flanking regions of the first and last 3′ UTR PASs in S. cerevisiae (left) and S. pombe (right).