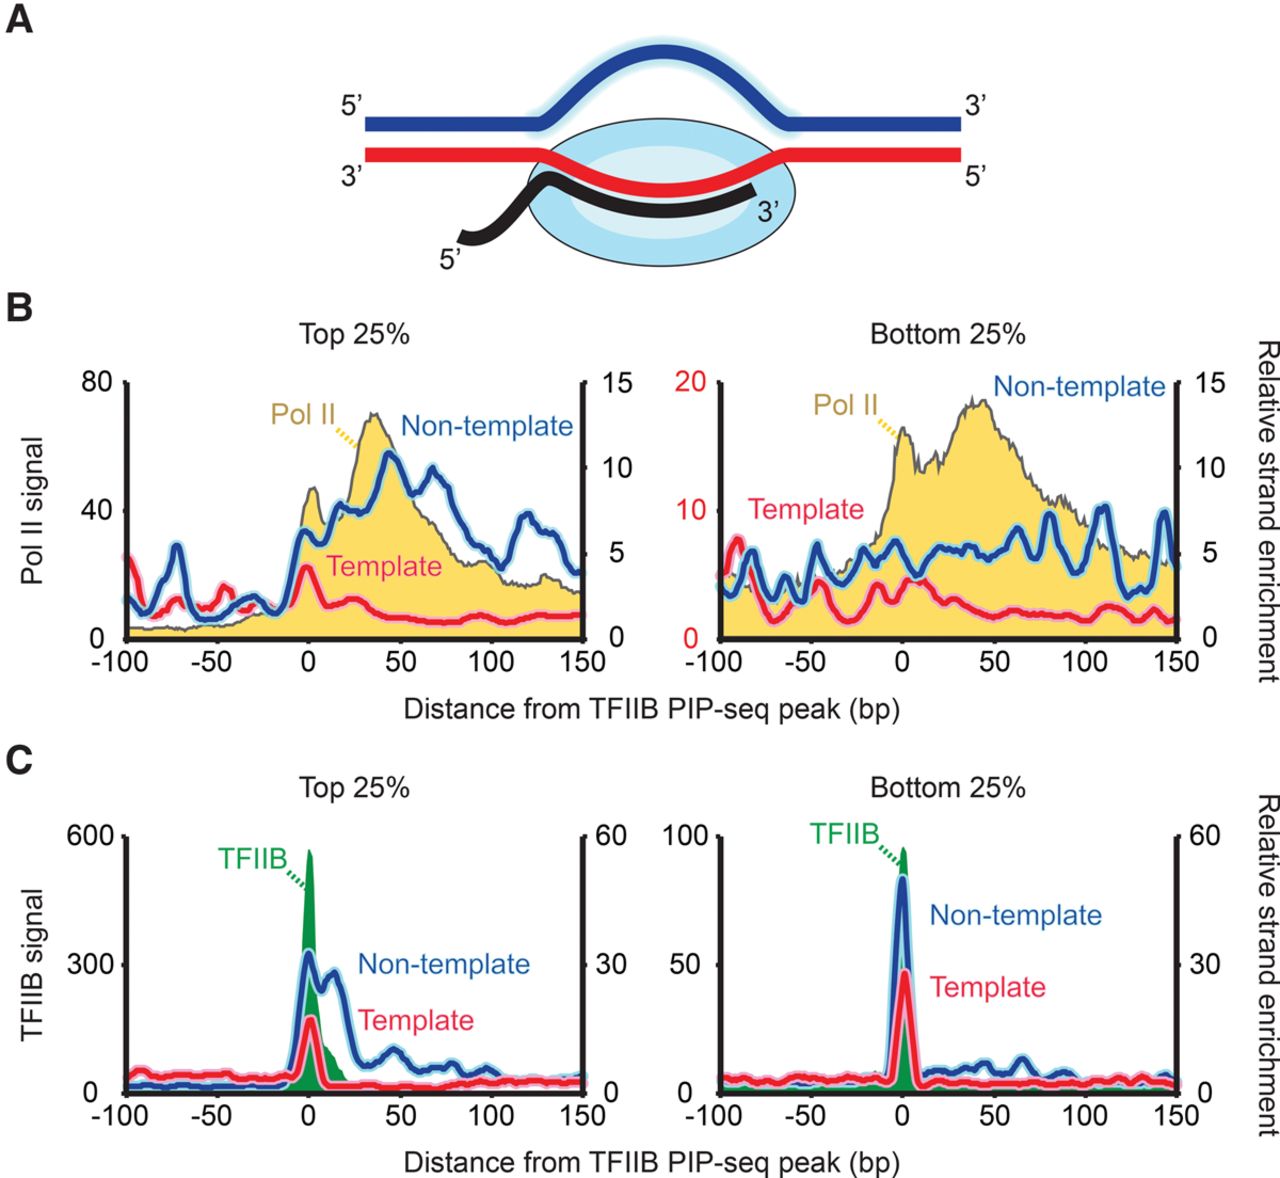
Figure 2.
Pol II directionality measured by PIP-seq. (A) Cartoon depicting variable solvent accessibility at the Pol II active site driven by the presence of the transcribing complex and RNA. (B) Composite plot of Pol II PIP-seq tags separated by the top and bottom 25% of TFIIB PIP-seq occupancy (yellow) overlaid by strand-separated Pol II PIP-seq tags (blue and red). Separate strands are normalized by corresponding strand-separated −1 “A” tags to remove ChIP signal and leave only specific strand enrichment. The y-axes are scaled differently between the top and bottom 25% in order to better visualize the relative enrichment patterns. (C) Same as panel B but for TFIIB PIP-seq (green).