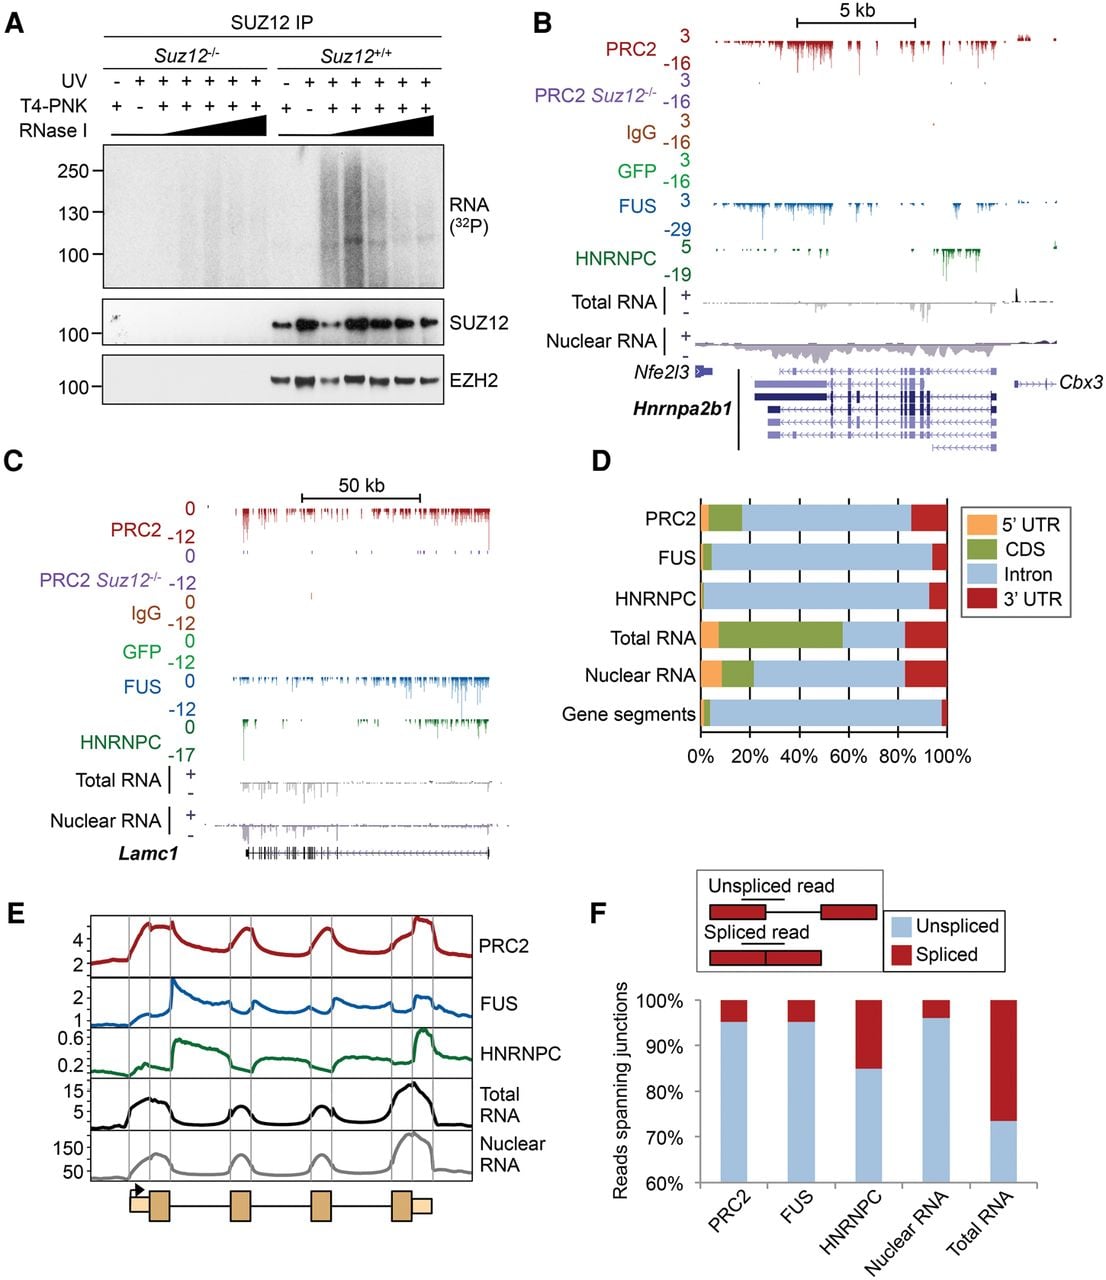
PRC2 has a characteristic RNA binding profile with enrichment at exon–intron boundaries and the 3′ UTR. (A) SDS-PAGE for RNPs enriched by CLIP for endogenous SUZ12 in the wild type (WT) and Suz12−/− ESCs. The autoradiogram is shown at the top; the corresponding SUZ12 and EZH2 immunoblots, below. CLIP was performed with and without UV crosslinking and T4-polynucleotide kinase (T4-PNK) and with increasing concentrations of RNase I (1, 2, 4, 10, and 20 U/mL). (B) Significant PRC2 RNA crosslink sites (FDR < 0.05) at Hnrnpa2b1. Significant crosslinks are also marked for FUS, HNRNPC, GFP, and IgG controls and for PRC2 in Suz12−/− cells. Counts of Watson and Crick strand crosslinks per base are shown by positive and negative integers, respectively. Nuclear and total RNA-seq read densities (reads per million [RPM]) are shown below. Scale is denoted by the bar above. (C) As B, except for Lamc1. (D) Percentage of significant crosslink sites or RNA-seq reads in different gene segments. The percentage of bases within each segment is shown for comparison. (E) Composite crosslink density profiles (crosslinks per million) across an average gene, divided into exons and introns and 1 kb of flanking sequence, with the first and last exons additionally divided into UTR and CDS. Total and nuclear RNA-seq read densities are shown for comparison. Segment length is arbitrary. (F, top) Cartoon showing the identification of reads which span exon–intron boundaries or exon–exon boundaries. (Bottom) Relative proportions of iCLIP or RNA-seq reads that span exon–intron (unspliced; blue) or exon–exon boundaries (spliced; red), as a percentage of all reads spanning a junction.