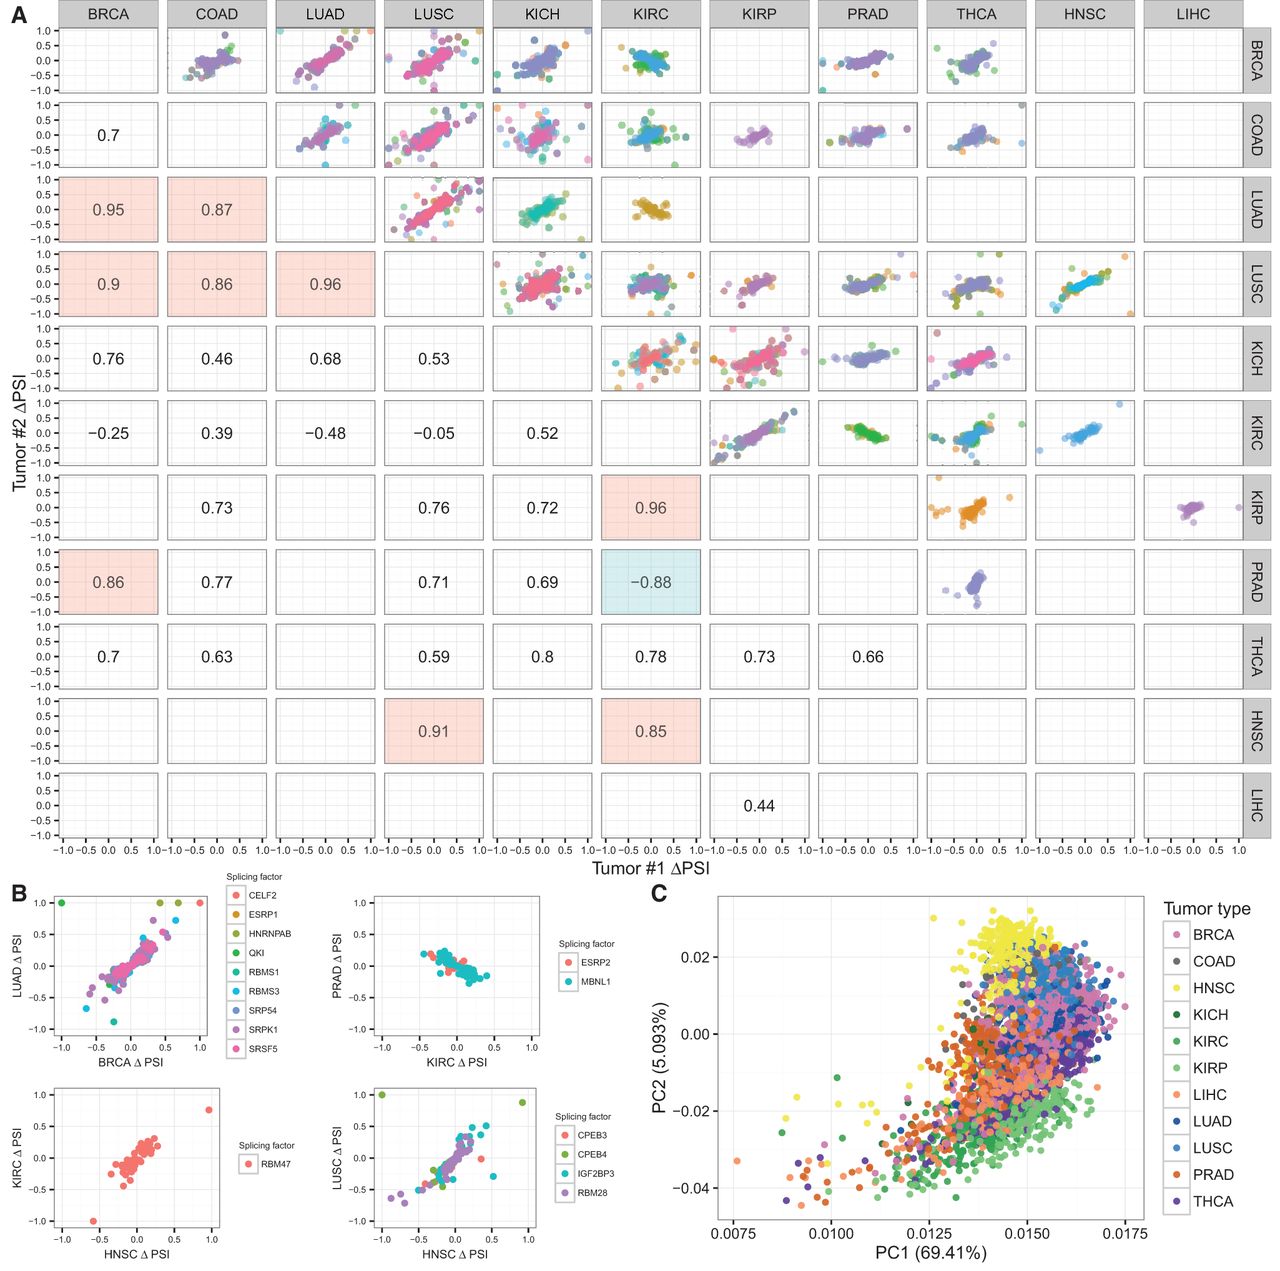
Common and specific events in tumors. (A) Common events and splicing factors between pairs of tumor types. For each pair of tumor types and for each splicing factor differentially expressed in both tumor types, we plot the correlation of ΔPSI values for events that have a correlation of |R| > 0.5 (Spearman) with these splicing factors in both tumor types. Only factors with more than 50 associated events in both tumor types are shown. Each event is only plotted once, and the color of the plot corresponds to the most common correlating splicing factor. Correlations between ΔPSI values are indicated. In red or green, we highlight those higher than 0.8 or lower than −0.8, respectively. (B) ΔPSI correlations for the pairs LUAD–BRCA, PRAD–KIRC, KIRC–HNSC, and LUSC–HNSC, for the common events separated according to their potential splicing factor regulators. Points representing the same event associated with more than one factor are plotted with a slight displacement to avoid overlap. (C) Principal Component Analysis (PCA) plot of 380 tumor-specific alternative splicing events colored by tumor type.