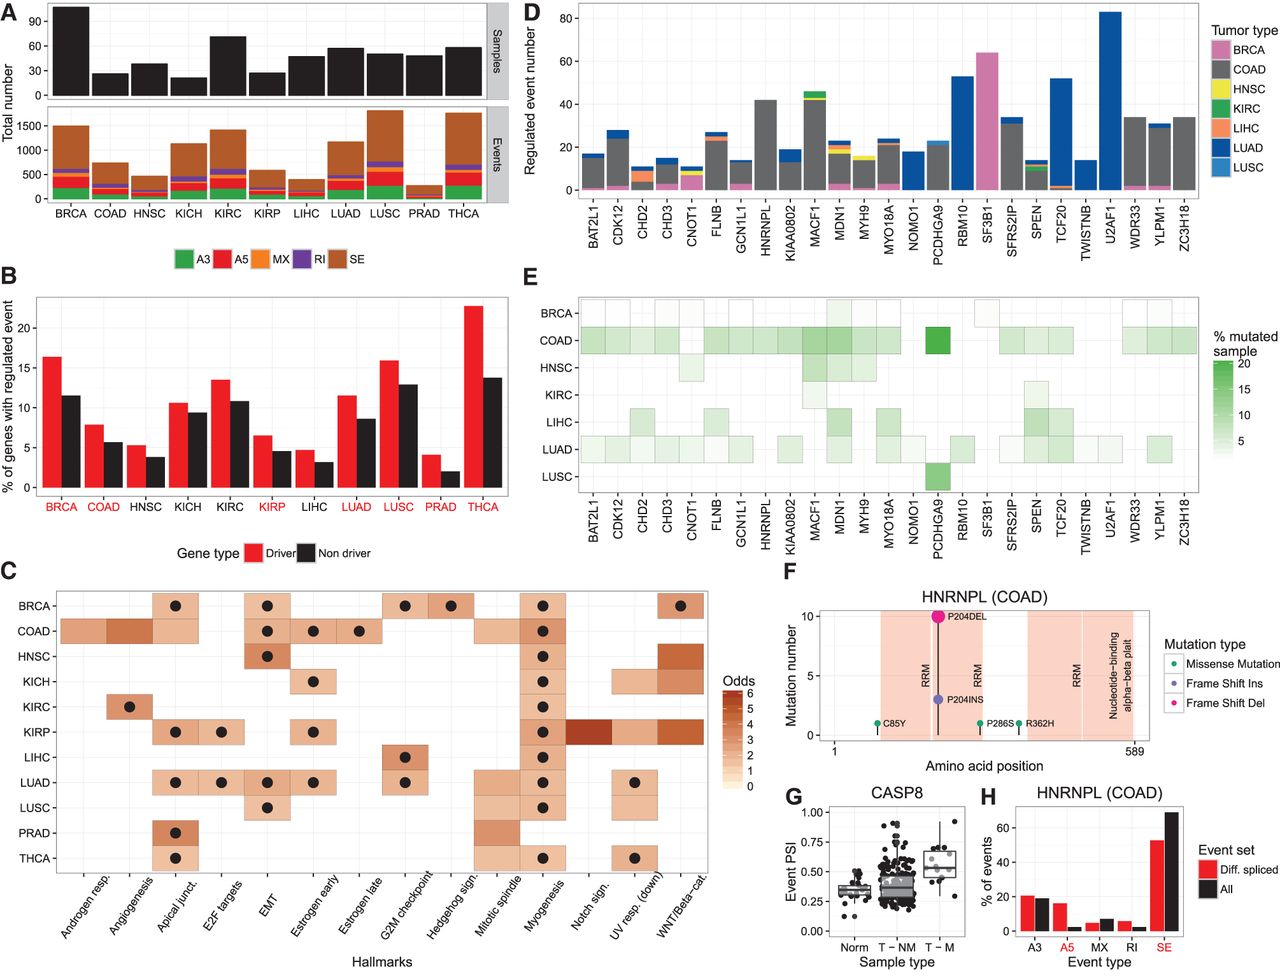
Differentially spliced events in tumors. (A, upper panel) Number of paired-samples used per tumor type. (Lower panel) Number of differentially spliced events per tumor type compared to normal samples, split according to type of event: alternative 3′ splice-site (A3), alternative 5′ splice-site (A5), mutually exclusive exon (MX), retained intron (RI), and skipping exon (SE) (Supplemental Table S6). (B) Proportion of driver and nondriver genes with differentially spliced events. We indicated in red those tumors for which the enrichment is significant. (C) Cancer hallmarks (x-axis) that are enriched (Fisher's exact test P-value < 0.05) in differentially spliced events in each tumor type (y-axis). The color indicates the odds ratio of the enrichment. Hallmarks that are also enriched according to gene expression are indicated with a black dot. (D) Number of differentially spliced events related to protein-affecting mutations in RBP genes color-labeled by tumor type. Only cases with at least 10 associated differentially spliced events are shown. SF3B1 is included for comparison. (E) Proportion of samples per tumor type with protein-affecting mutations in RBP genes with at least 10 associated differentially spliced events. (F) Number of protein-affecting mutations (y-axis) along the HNRNPL protein (x-axis), color-labeled according to whether they are substitutions, insertions, or deletions. Protein domains are indicated in light red. (G) Distribution of PSI values for the A5 event in CASP8 associated with the mutations of HNRNPL in COAD, separated into normal samples (Norm), tumor samples without protein-affecting mutations (T–NM), and tumor samples with protein-affecting mutations (T–M). (H) Enrichment or depletion of specific event types in association with mutations in HNRNPL (red bars) compared to the overall proportions of events (black bars). Significant differences (P < 0.05, Fisher's exact test) are labeled in red. Contingency tables are provided in Supplemental Table S12.