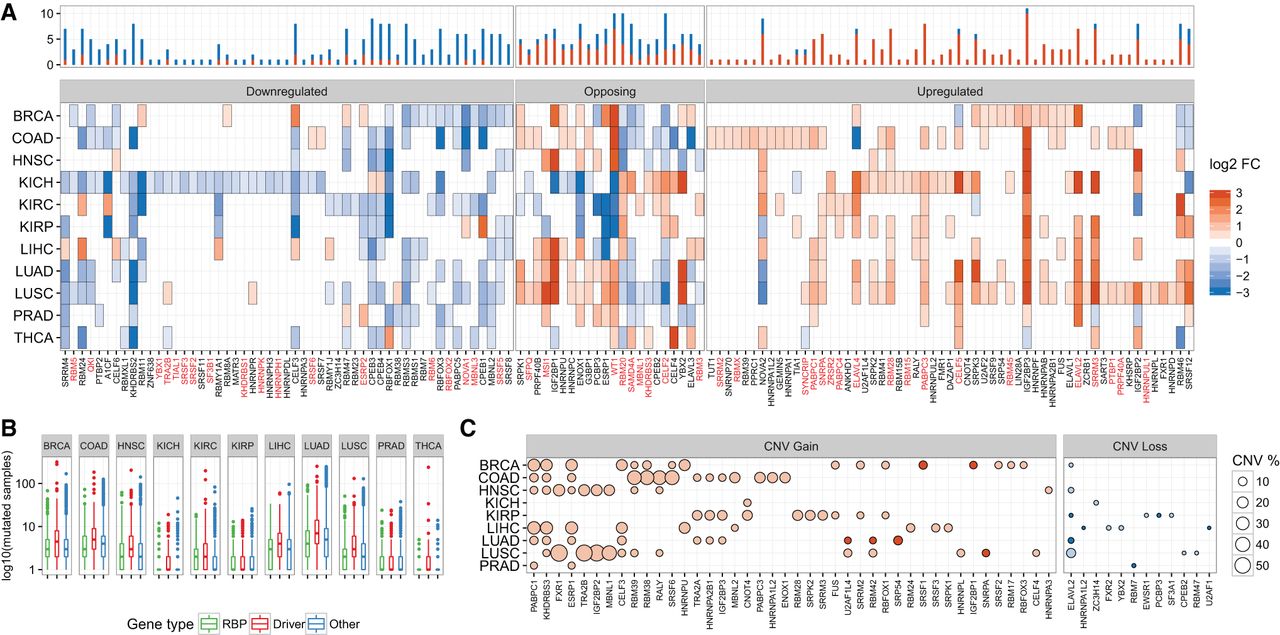
Cancer alterations in splicing factors. (A) Up- (red) and down-regulation (blue) patterns splicing factors (x-axis) in the different tumor types (y-axis) compared to normal samples. Only the 132 SFs (out of 162 tested) with differential expression are shown. The color intensity indicates the log2-fold change (log2 FC). The bar plot above indicates the frequency of tumor types with up- (red) or down- (blue) regulation for each factor. Factors are clustered into three groups according to whether they show frequent down-regulation (Downregulated) or up-regulation (Upregulated) in tumors, or whether they tend to show an opposite pattern between the three kidney tumors (KICH, KIRC, KIRP) and the rest of the tumor types (Opposing). Factors previously described to have oncogenic or tumor-suppressing activities (Supplemental Table S3) are labeled in red. SF3B1, SRPK1, SRPK2, and SRPK3 were included for comparison. (B) Number of samples in log10 scale (y-axis) in which RBPs (green), driver genes (red) (Supplemental Tables S5, S6), and the rest of the genes (blue) show mutations in each tumor type (x-axis). Distributions are represented as box plots, with outliers represented as dots. All comparisons of drivers vs. RBPs or drivers vs. others are significant (one-sided Wilcoxon test P-values < 1.7×10⁻⁵). Comparisons of others vs. RBPs are significant (one-sided Wilcoxon test P-values < 0.05), except for LUAD, LUSC, and PRAD. Drivers were extracted from the literature (Methods). (C) Copy number variation (CNV) gains (left panel) and losses (right panel) of the tested splicing factors. The size of the circle corresponds to the proportion of samples with CNVs and darker colors represent cases where >50% of the CNVs are focal. Only those CNVs with a frequency of amplification > 5% or deletion > 1% are shown.