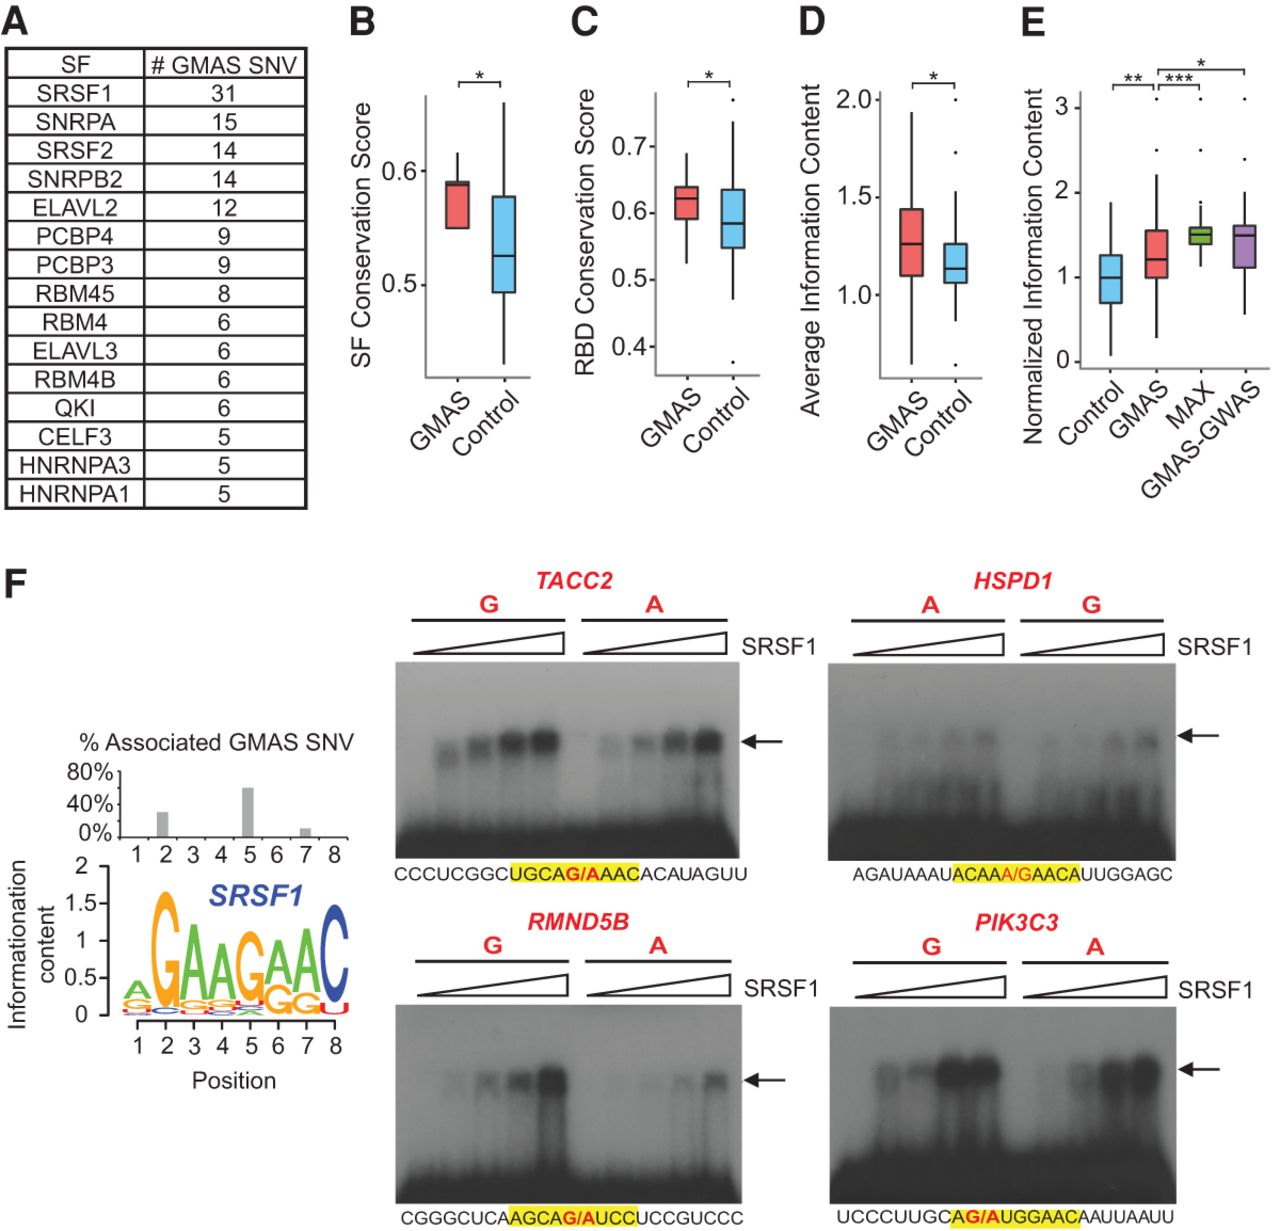
GMAS SNVs alter the binding of splicing factors. (A) Splicing factors predicted to target at least five GMAS SNVs (ranked by the number of their GMAS targets). (SF) Splicing factor. (B) Amino acid conservation scores of the GMAS-associated splicing factors (GMAS) and control splicing factors (Control). The 15 splicing factors listed in A were included in this analysis. Controls were defined as all non-GMAS-targeting splicing factors. Known splicing factors were obtained from pervious literature (Han et al. 2013). (*) P = 0.004, Wilcoxon rank-sum test. (C) Amino acid conservation scores of the RNA binding domains (RBDs) of the splicing factors. The same splicing factors and controls as described in B were analyzed. (*) P = 0.012, Wilcoxon rank-sum test. (D) Average information content of sequence motifs of splicing factors. The same splicing factors and controls as described in B were analyzed. (*) P = 0.006, Wilcoxon rank-sum test. (E) Normalized information content of specific nucleotide positions in the sequence motifs of the 15 splicing factors in A (Supplemental Methods). Normalization was carried out against the average information content of all nucleotides within each motif. (Control) A random nucleotide in a sequence motif; (GMAS) the nucleotides disrupted by GMAS SNVs; (MAX) the strongest consensus positions of each motif; and (GMAS-GWAS) the nucleotides disrupted by GMAS SNVs that are in LD with GWAS SNPs. (*) P = 0.004, (**) P = 2.26 × 10⁻⁸, (***) P = 6.30 × 10⁻¹², Wilcoxon rank-sum test. (F, left) The sequence logo of SRSF1 binding motif generated from the PWM provided by Ray et al. (2013). The percentage of GMAS SNVs targeting specific nucleotide positions of the SRSF1 motif is shown as a bar plot above the sequence logo. (Middle, right) EMSA results of SRSF1 binding to predicted GMAS targets. Alternative alleles of the GMAS SNVs were synthesized, as labeled above the gel images. The sequences of the synthetic RNA fragments are shown below each gel image, where the SRSF1 sequence motif is highlighted in yellow and the two alleles of GMAS SNVs are written in red. The arrow indicates RNA–protein complex. Increasing concentrations of SRSF1 were used in different lanes of the gel image (from left to right: 0, 0.37, 0.75, 1.5, and 3.0 µM).