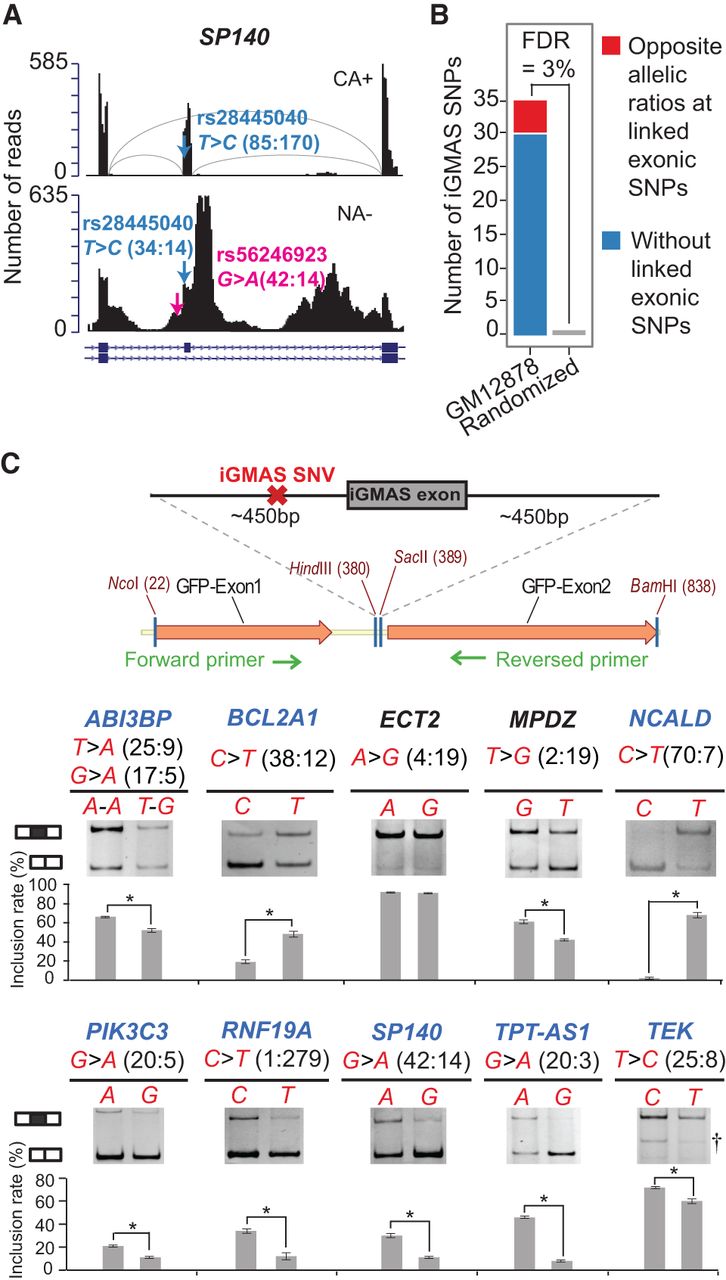
Evaluation of the iGMAS method. (A) An example iGMAS event. Read distributions of the region in the gene SP140 around an iGMAS event identified in GM12878 are illustrated using the CA+ (upper) and NA− (lower) data, respectively. Exon–intron structures (RefSeq annotation) are shown at the bottom. Pink arrow and text denote iGMAS SNP location, allele types, and number of reads harboring each allele in NA− data. This iGMAS exon also has an exonic SNP whose information is provided in blue (haplotypes: T-G, C-A). As expected for an authentic iGMAS event, the exonic SNP has opposite allelic bias in CA+ and NA− data (i.e., allele C enriched in CA+ but underrepresented in NA−). Arcs in light gray represent existence of spliced junction reads across exons. (B) The number of iGMAS events identified in GM12878 cells (blue and red) where five events (red) had corresponding exonic SNVs (all of which showed opposite allelic ratios comparing their allelic coverage in the CA+ and NA− fractions). Only one iGMAS event was identified in the randomized data (Methods), yielding an estimated a false-discovery rate (FDR) of 3%. (C) The minigene system used for experimental validation of iGMAS events is illustrated (Supplemental Methods). Validation results in HeLa cells of 10 randomly picked iGMAS events are shown. Alternative alleles of iGMAS SNVs are shown together with their read counts in NA− data. All events but one (ABI3BP) had only one iGMAS SNV. Mean and SD of exon inclusion levels based on three biological replicates are shown. As expected for successful validation, the more enriched allele in NA− RNA-seq data should be associated with a smaller exon inclusion level in the splicing assay. Among the 10 iGMAS events, eight (gene names in blue) were successfully validated in HeLa cells. (*) P ≤ 0.05, Wilcoxon rank-sum test; (†) nonspecific bands.