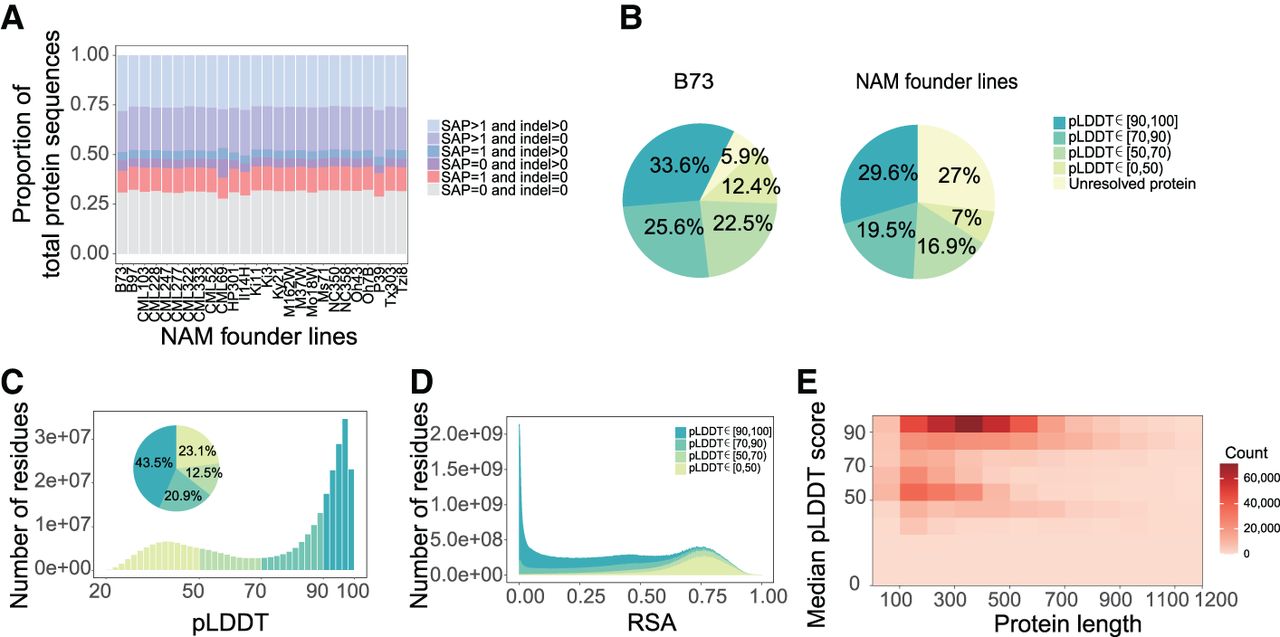
Protein 3D structure predictions for 26 maize NAM founder lines using AlphaFold2. (A) Protein sequence diversity in maize NAM founder lines. Each NAM founder line was compared with other NAM founder lines in pairs. (SAP) Single amino-acid polymorphism, (indel) insertion/deletion. (B) Percentage of predicted protein 3D structures at different confidence levels in B73 (left; total count: 72,539) and NAM founder lines (right; total count: 1,089,242); colors represent median confidence scores. Unresolved protein structures were not predicted; see Methods. (C) Distribution and percentage of confidence scores for all NAM founder lines residues. The histogram shows the density distribution of confidence scores, and the pie chart shows the percentage of confidence scores. (pLDDT) Predicted local distance difference test. (D) Distribution of RSA for residues in all NAM founder lines. (RSA) Relative solvent-accessible surface area. (E) Heatmap representing median confidence scores of protein structures as a function of protein length in all NAM founder lines.