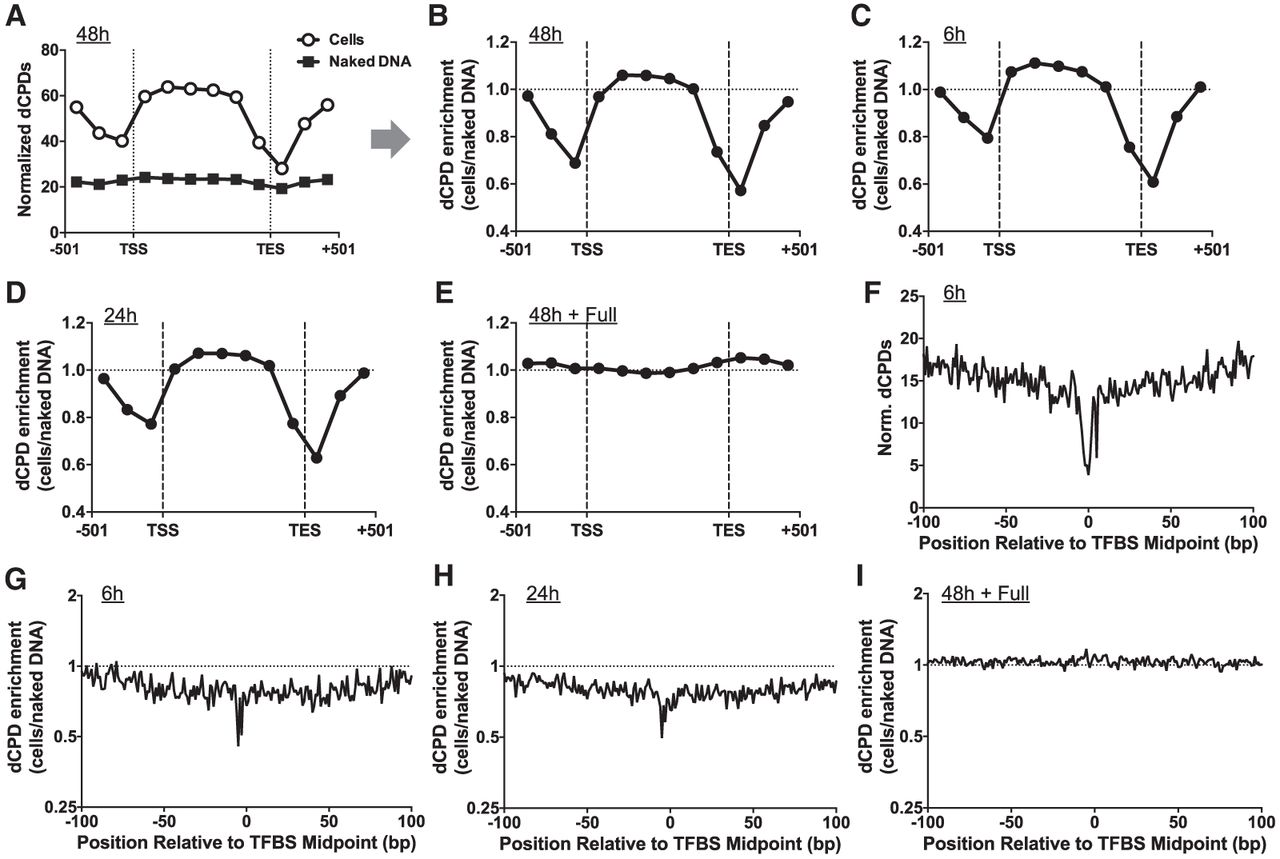
CPD deamination is suppressed near the TSS and TES of yeast genes and adjacent to transcription factor binding sites. (A) Normalized frequency of dCPDs following 48 h of deamination after UV irradiation of yeast cells. Lines with open circles and gray squares indicated data for cellular and in vitro (control) experiments, respectively. Data are plotted for about 5000 yeast genes in aggregate. Each gene was divided into six equally sized bins, and the number of dCPD lesions, derived from the count of dCPD-seq reads associated with cytosines in dipyrimidine sequences, was tallied for each bin. dCPDs associated with six 167 bp flanking bins, three upstream of the TSS and three downstream from the TES for each gene, were also tallied. The frequency of dCPD-seq reads in each bin was normalized using the count of cytosine-containing dipyrimidines in each bin. TSS and TES coordinates are from Park et al. (2014). (B) Same as panel A, except the dCPD enrichment, which is defined as the number of dCPDs in the cellular deamination experiments relative to the in vitro deamination control, is depicted. dCPD enrichment was normalized by the total number of dCPDs in each sample. (C–E) Same as panel B, except for the 6 h (C), 24 h (D), and full (E) deamination samples. (F) Normalized dCPD frequency following 6 h deamination in UV-irradiated yeast cells at 1893 binding sites for 78 different yeast transcription factors. The dCPD-seq data at each position were normalized by the frequency of cytosine bases in a dipyrimidine sequence context. TFBS data are from Rossi et al. (2021). (G) Same as panel F, except plotting dCPD enrichment at yeast TFBSs, which is calculated from the normalized ratio of cellular dCPD-seq reads at each position relative to the in vitro deamination control. (H,I) Same as panel G, except dCPD enrichment for the 24 h (H) and full (I) deamination sample is plotted.