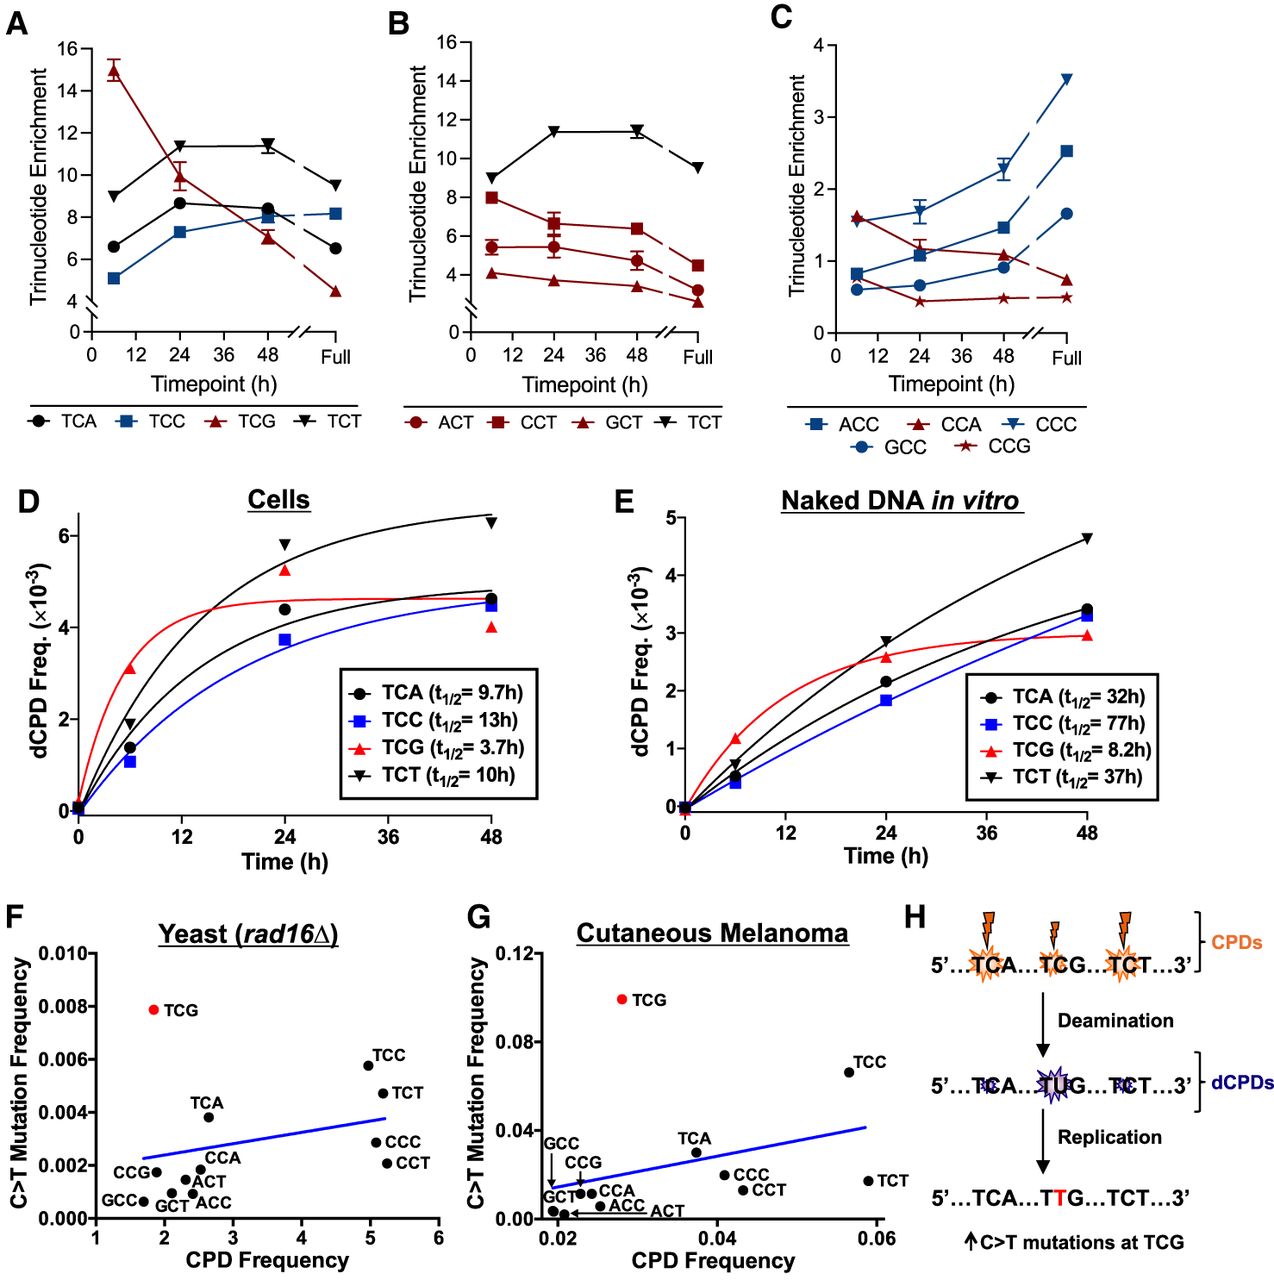
DNA sequence context significantly modulates cellular CPD deamination, likely impacting UV mutagenesis. (A–C) The fraction of total dCPD-seq reads mapping to each cytosine-central trinucleotide context was normalized by the fraction of the individual trinucleotide sequences in the yeast genome (resulting in “trinucleotide enrichment”) and plotted as a function of 37°C incubation time. Red lines/symbols indicate fast deaminating sequence contexts; blue indicates relatively slow deaminating sequence contexts; and black is intermediate. Results are grouped by TCN (A), NCC/CCN (B), and NCT contexts (C). The 6 h, 24 h, and 48 h results represent the average and SEM from three independent experiments. The 0 h results are from two experiments, and the “full” deamination time point is derived from a single experiment. (D) Quantitation of dCPD lesions in cellular deamination samples across the yeast genome at the indicated trinucleotide sequence contexts. dCPD frequency was calculated from frequency of dCPD-seq reads at each trinucleotide context and scaled using the alkaline gel data for the cellular deamination time course. The calculated half-life (t1/2) of a single exponential fit to each trinucleotide deamination time course is indicated. (E) Same as panel D, except for UV-irradiated naked yeast genomic DNA that was deaminated in vitro (see Fig. 1). (F) The frequency of C > T single-base substitutions in different trinucleotide contexts (e.g., TCG, etc.) is plotted relative to the frequency of UV-induced CPD lesions in each context. Mutation data are derived from whole-genome sequencing of UV-irradiated rad16Δ yeast cells (Laughery et al. 2020), whereas CPD frequency is derived from CPD-seq data from UV-irradiated rad16Δ yeast cells (0 h time point) (Mao et al. 2020). Blue line indicates the linear regression fit to the data. The mutation frequency at TCG (0.00788; shown in red) is a significant outlier relative to other contexts and lies outside the 95% confidence interval of the predicted value based on its CPD frequency (0.00235 ± 0.00539). (G) Same as panel F, except mutation frequency is derived from published whole-genome sequencing data from 140 cutaneous melanomas (Hayward et al. 2017), and CPD frequency is derived from published CPD-seq data from UV-irradiated melanoma cells (Lindberg et al. 2019). Again, the mutation frequency at the TCG (0.0993; shown in red) is a significant outlier and lies outside the 95% confidence interval of the value predicted from its CPD frequency (0.0201 ± 0.0683). (H) Model depicting potential mechanism for elevated C > T mutations at TCG contexts in yeast and human skin cancers. Although the frequency of CPD lesions is somewhat lower at TCG than other contexts (e.g., TCA or TCT), its deamination occurs much more rapidly, leading to mutation enrichment.