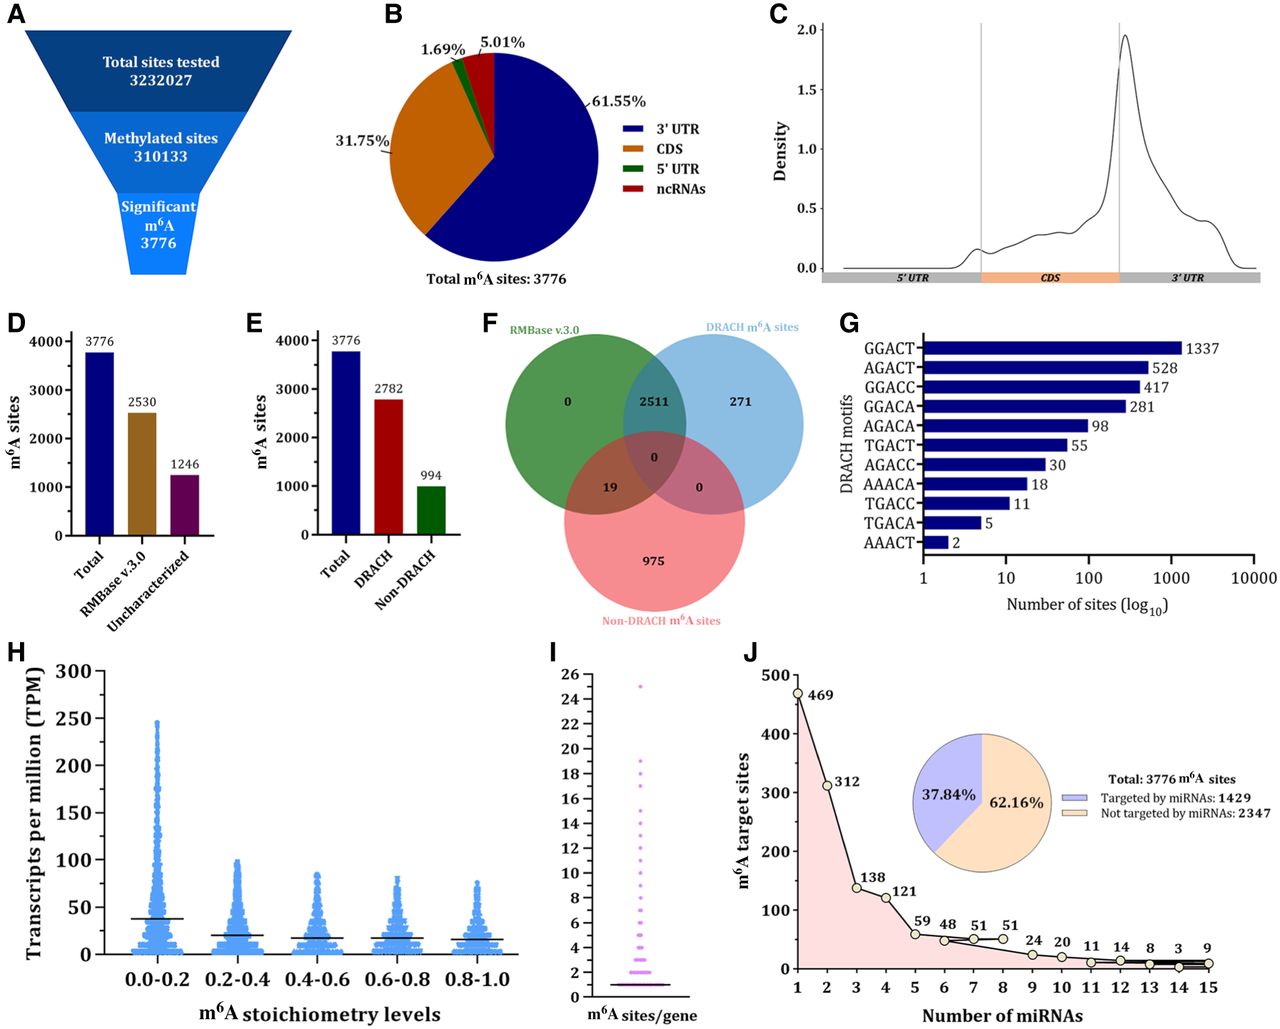
Descriptive analysis of the direct RNA sequencing data sets from HeLa cells. (A) Funnel plot exhibiting the total number of tested adenosine sites in mRNAs, the number of detected methylated sites, and the number of m6A with high confidence (probability > 0.9999). (B) Distribution of the identified m6A sites across the distinct regions of mRNAs (UTRs and CDS) as well as the proportion of m6A in ncRNAs. (C) Density plot highlighting the relative abundance of the detected m6A sites throughout the distinct regions of mRNAs (5′ UTR, CDS, and 3′ UTR). (D) Bar plot illustrating the number of detected m6A sites that have been already deposited in RMBase v3.0, as well as the count of m6A sites that are not characterized. (E) Bar plot indicating the total count of m6A sites identified in DRACH and non-DRACH motifs of mRNAs. (F) Venn diagram showing the overlap between high-confident m6A sites identified in this study (CHEUI probability > 0.9999) and sites deposited in RMBase v3.0. Only the 3776 high-confident sites detected by direct RNA sequencing are included in this analysis. (G) Total number of high-confident (probability > 0.9999) m6A sites corresponding to each 5′-DRACH-3′ motif on the mRNAs of HeLa cells. For visual purposes, the log10 value of the total count is plotted for each motif. (H) Scatter plots exhibiting the association of m6A methylation with transcript abundance. Transcripts were stratified into groups based on the m6A stoichiometry. Expression levels are shown using the transcript-per-million (TPM) method. (I) Number of high-confident (probability > 0.9999) m6A sites per gene. A black horizontal line is used to demonstrate the median value. Only genes containing at least one m6A site are demonstrated. (J) Proportion of high-confident m6A sites (CHEUI probability > 0.9999) located within experimentally validated miRNA target regions. Binding site coordinates were obtained from the DIANA-TarBase v8 database and mapped to the transcriptome to assess overlap with identified m6A sites.