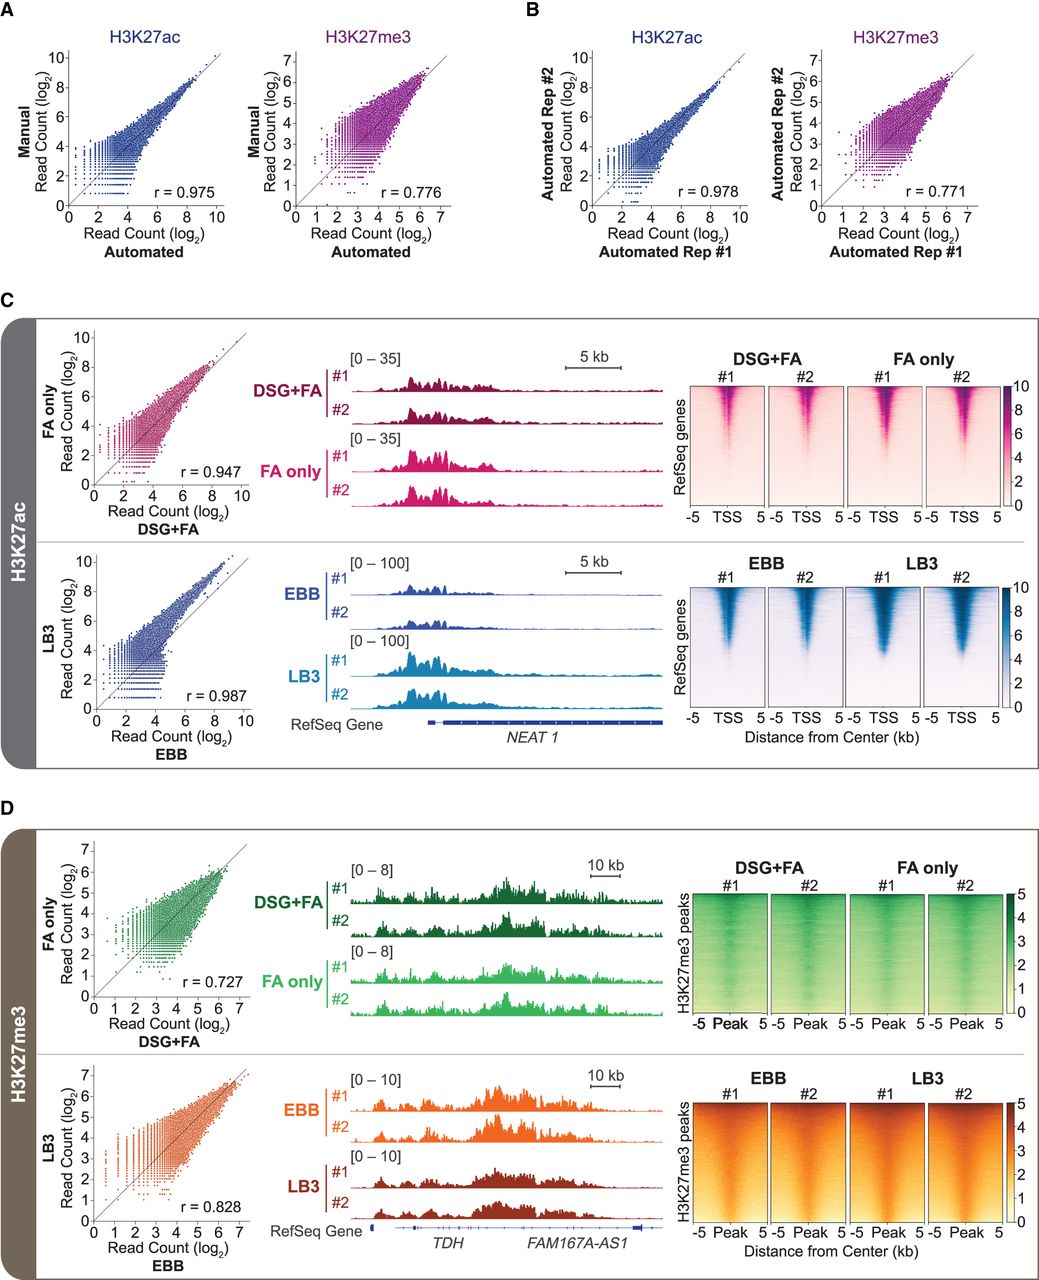
Systematic evaluation of spa-ChIP-seq with comparison to manual workflow, cross-linking conditions, and buffer compositions. (A,B) Scatterplots comparing normalized read counts (log2) between automated and manual ChIP-seq samples (A) and automated replicates (B) at H3K27ac or H3K27me3 shared peaks. (C,D) Scatterplots of read counts (log2) on shared peaks, IGV (Robinson et al. 2011) tracks, and heatmaps of ±5 kb from the center of transcription start sites (TSSs) or peaks showing the automated ChIP-seq results of H3K27ac (C) and H3K27me3 (D) for evaluating cross-linking conditions, DSG+FA versus FA only (top), and buffer compositions, EBB versus LB3 (bottom). The Pearson r correlation coefficients are reported on the lower right corner of the scatterplots. A total of 32 ChIP-seq experiments were performed, 16 of them using spa-ChIP-seq and 16 of them using manual ChIP-seq, with additional data in Supplemental Figure S2.