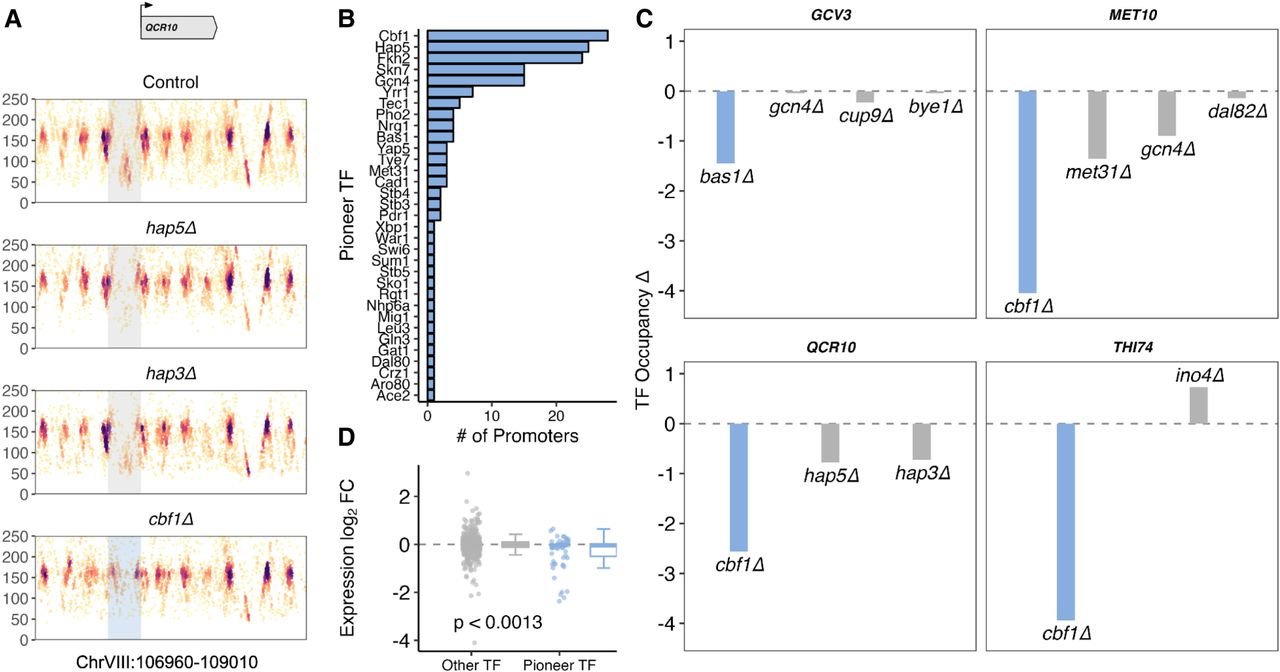
Analyzing changes in TF occupancy elucidates differential binding activity at promoters. (A) MNase fragment plot at the QCR10 locus. Top panel shows the control, when Cbf1, Hap3, and Hap5 are all available to bind in the promoter. Subsequent panels show what happens when one of those TFs is deleted. The HAP3 mutant retains much TF binding; the HAP5 mutant has less TF binding; and the CBF1 mutant has no TF binding (and an upstream nucleosome has shifted into the promoter), suggesting that Cbf1 exhibits pioneering activity at this locus. (B) Bar plot of TFs and the number of promoters at which they exhibit pioneering activity. (C) Bar plots representing, at four different gene promoters, the change in TF occupancy as a result of various TF deletion mutants. Individual bars represent the effect of deleting a single TF and are colored blue to indicate the TF labeled as pioneering. (D) Comparison of expression change in log2(FC) of genes between deleted TFs labeled or not labeled as pioneering.