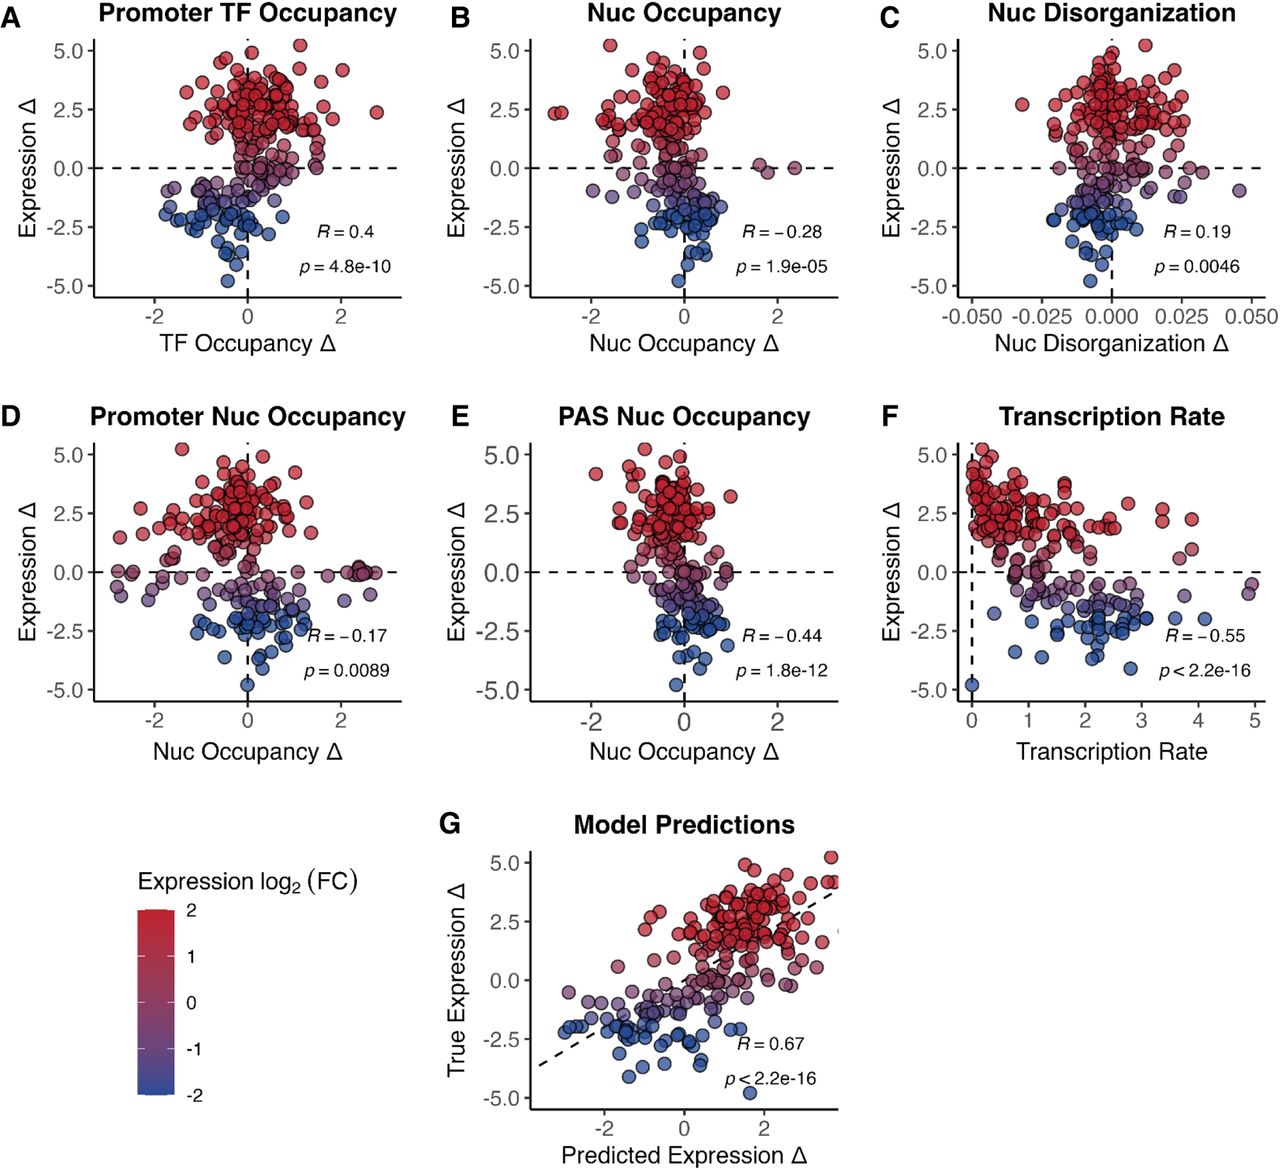
Relationship between gene expression changes and chromatin features. Each point represents a significant mutant–gene interaction. Points are colored based on log2(FC) in gene expression (red, upregulated; blue, downregulated). Change in gene expression (y-axis) as a function of change in TF occupancy in the promoter (A), nucleosome occupancy in the gene body (B), nucleosome disorganization in the promoter and gene body (C), nucleosome occupancy in the promoter (D), and nucleosome occupancy at the polyadenylation site (PAS; E). (F) Change in gene expression as a function of the NET-seq transcription rate (Churchman and Weissman 2011). (G) Multiple linear regression model incorporating all chromatin features and transcription rate to predict change in gene expression. All R values are Pearson correlations.