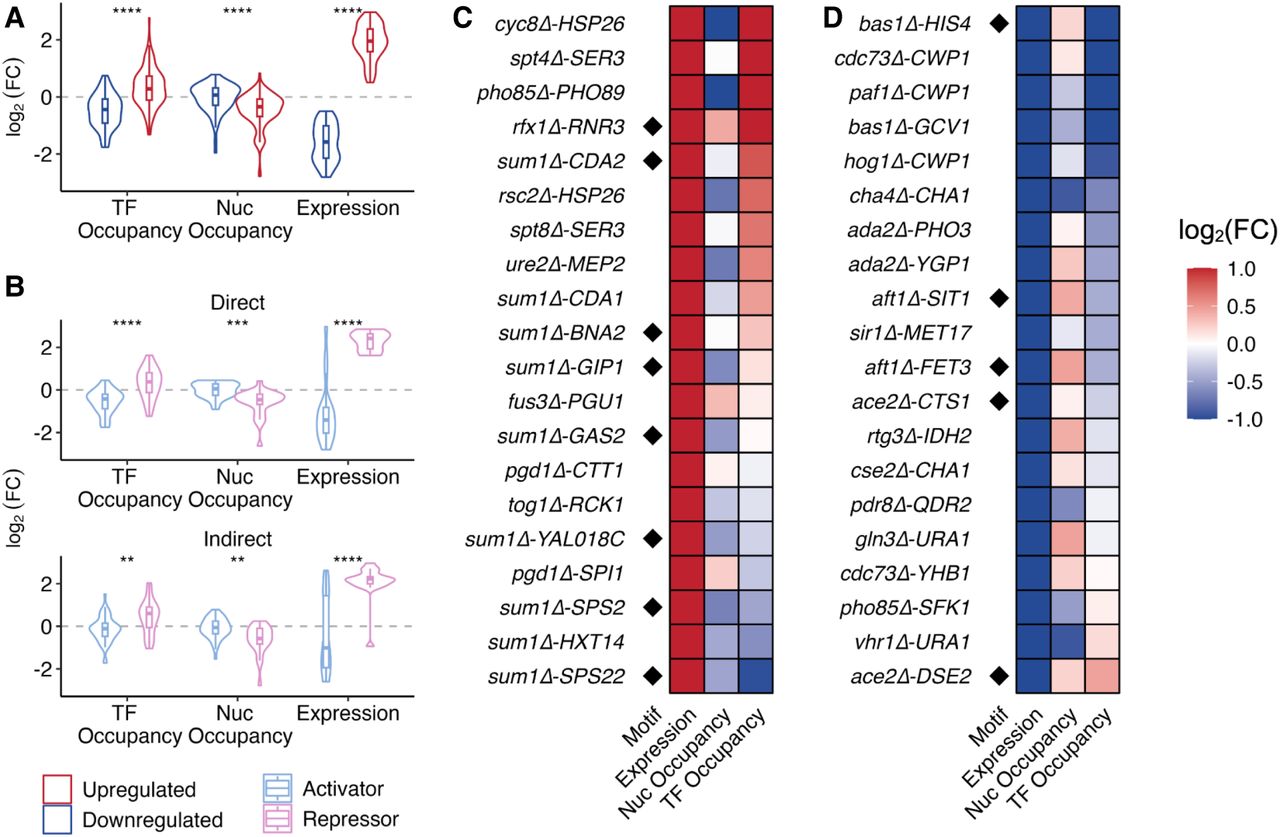
Distinct chromatin signatures between upregulated and downregulated genes. (A) Violin plots comparing the log2(FC) of TF occupancy at promoters, nucleosome occupancy within gene bodies, and gene expression between upregulated and downregulated genes. Upregulated genes (in red) are characterized by a gain in TF occupancy at the promoters and a loss in nucleosome occupancy within gene bodies, whereas downregulated genes (in blue) are characterized by a loss in TF occupancy at promoters. Significance of comparisons was evaluated using a standard t-test. (B) Violin plots comparing the log2(FC) of TF occupancy at promoters, nucleosome occupancy within gene bodies, and gene expression between established activators (light blue; n = 82) and repressors (pink; n = 25). Plots are split between direct (top) and indirect (bottom) interactions, in which a gene is labeled as direct if it involves a direct interaction implied by a motif (FIMO) or binding site (MacIsaac et al. 2006 and/or Rossi et al. 2021) in the target promoter and is labeled as indirect otherwise. (C) The top 20 upregulated mutant–gene interactions based on change in gene expression. Interactions are sorted by TF occupancy change. Heatmap values are colored by log2(FC). (D) Top 20 downregulated mutant–gene interactions based on change in gene expression. Interactions are again sorted by TF occupancy change.