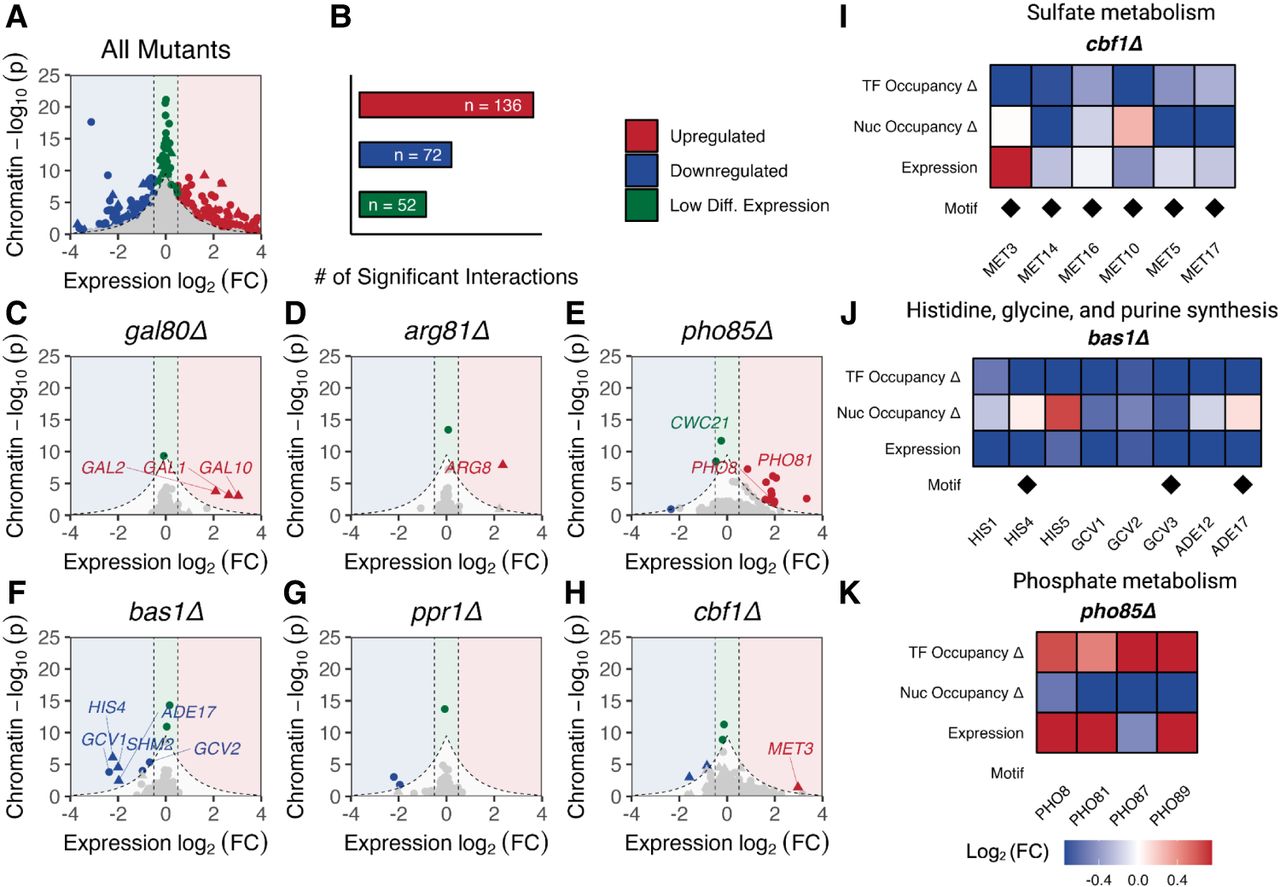
Chromatin changes are associated with gene expression changes in the context of genetic perturbation. (A) Scatter plot of all genes in all mutants plotted by their gene expression change (x-axis) and chromatin change (y-axis). Most points are gray and fall below the Laplacian significance threshold (see Methods). Colored points represent genes whose chromatin changes as a result of a single-gene perturbation were above the Laplacian threshold; a point is blue if the gene's expression is downregulated (log2(FC) ≤ –0.5), red if the gene's expression is upregulated (log2(FC) ≥ 0.5), and green if the gene exhibits low differential expression (–0.5 < log2(FC) < 0.5). Triangles represent direct interactions between the deleted TF and its target gene (on the basis of binding site evidence). (B) The number of upregulated, downregulated, and low differential expression interactions with significant chromatin changes. (C–H) Scatter plots of individual mutants and their target genes plotted by their gene expression change and chromatin change. Significant interactions are labeled as described in A. (I–K) Heat maps of TF and nucleosome occupancy changes and their associated gene expression changes for known biological pathways.