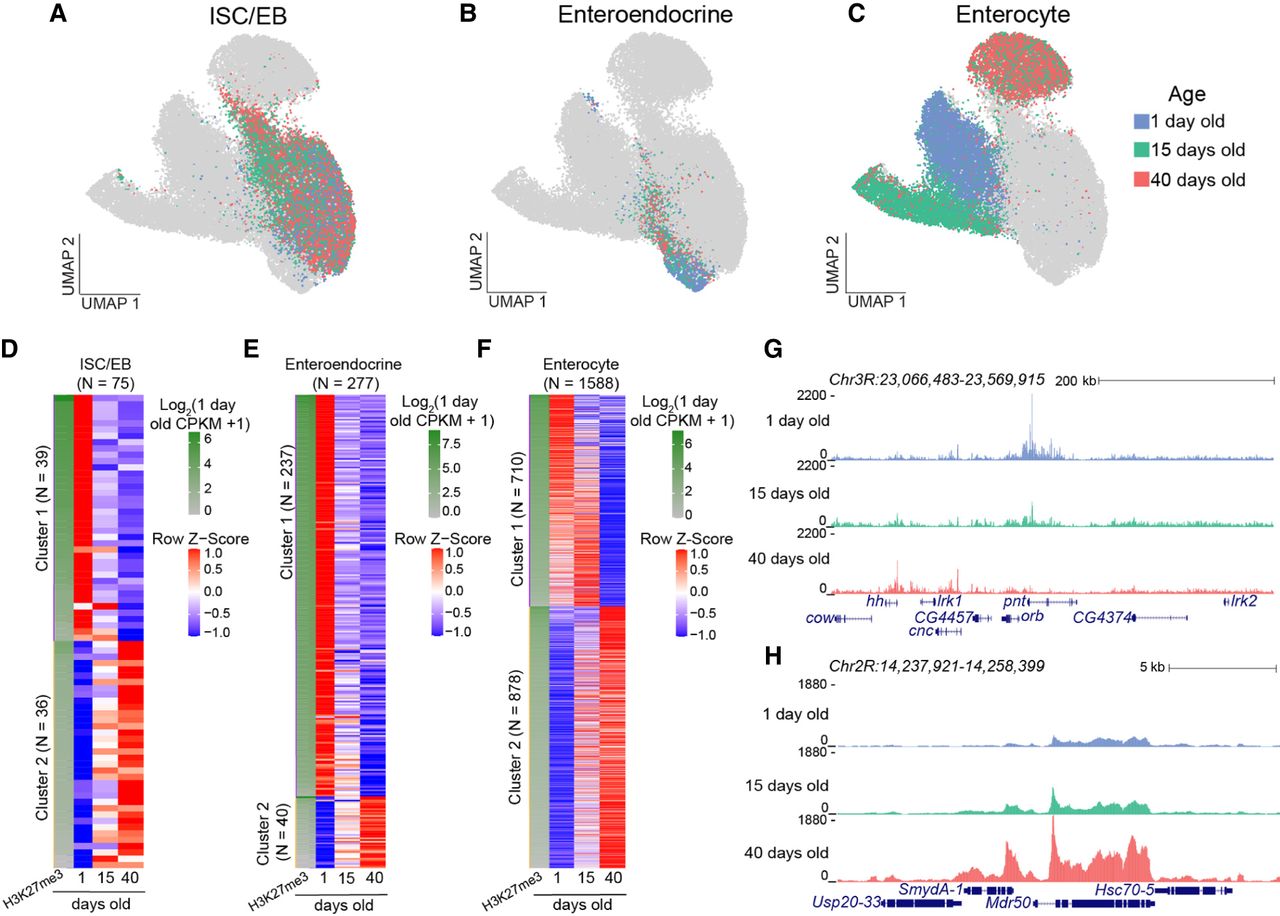
Changes in repressed landscapes in gut cells with age. (A–C) UMAPs of cell types from guts of different ages. Enteroendocrine cells and ISC/EBs of different ages are mixed within cell type clusters, but enterocytes form three separate clusters. (D–F) z-score-normalized heatmaps from differential analysis of H3K27me3 signal over genes between young and old cells. The first column of each heatmap is the log2-transformed CPKM for 1-day-old cells for each cell type. (D) ISC/EBs have an almost equal number of genes that lose (39 genes) and gain (36 genes) H3K27me3 signal with age. (E) Enteroendocrine cells show a greater number of losses of H3K27me3 signal (237 genes) compared with a gain in H3K27me3 signal (40 genes) with age. (F) Enterocytes have the greatest number of genes that show a change in H3K27me3 signal with age (1588 genes) with an age-related gain in H3K27me3 signal in 878 genes. It should be noted that genes that gain H3K27me3 signal are weak domains in young cells, and genes that show a loss of H3K27me3 signal are strong domains in young cells. (G,H) Genome browser tracks of genes that are differentially methylated in enterocytes, showing a loss (G) and gain (H) in H3K27me3 signal with age.