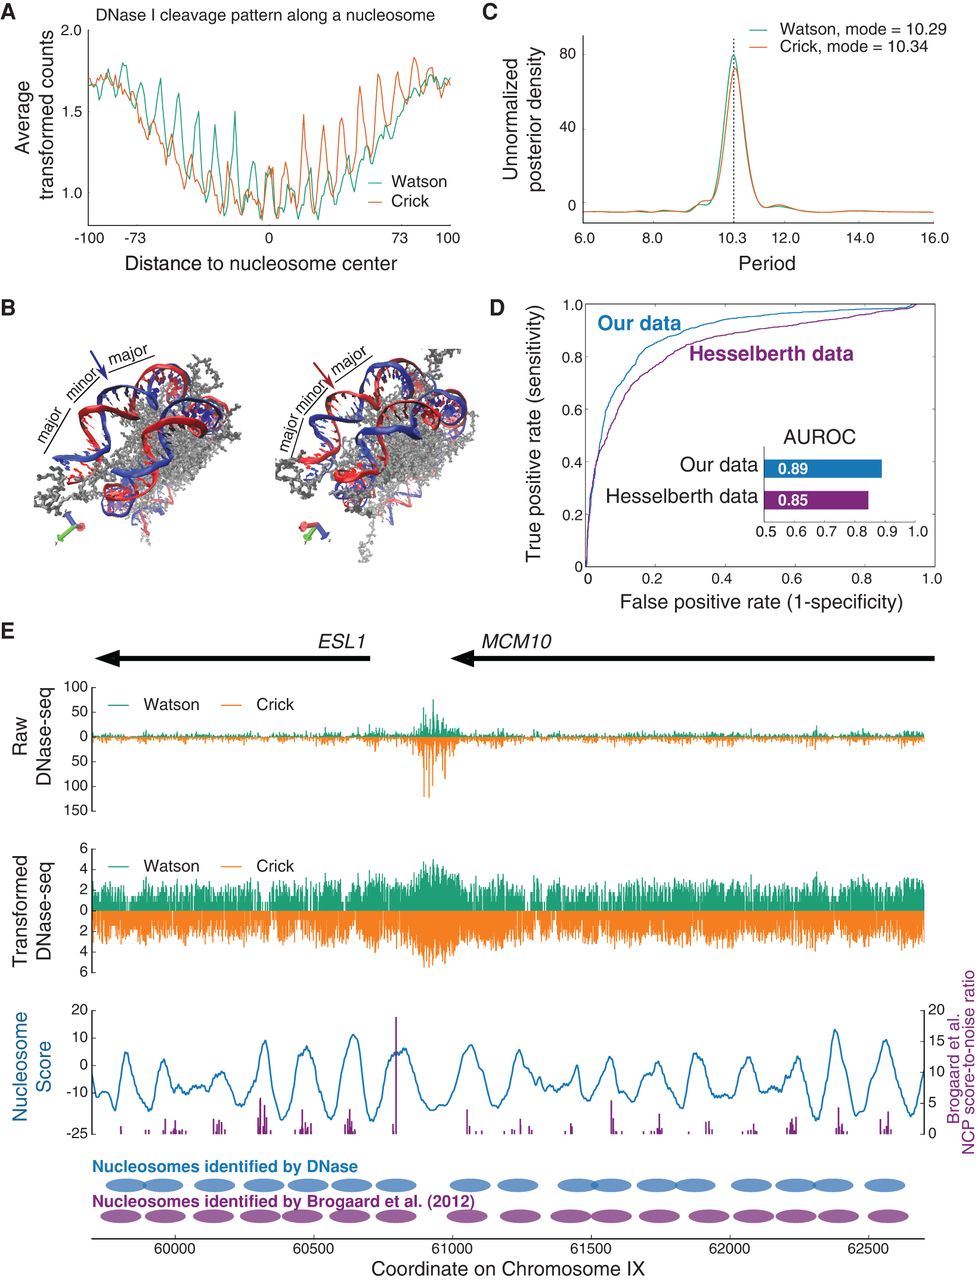
(A) Strand-specific cleavage profile of DNase I along the nucleosome, computed by averaging DNase-seq counts (transformed by the inverse hyperbolic sine function) within the 2000 most strongly positioned nucleosome sites in the yeast genome. (B) Crystal structure of a nucleosome shown from two angles (image created using Protein Data Bank entry 1AOI [Luger et al. 1997]). The strand that faces outward as the minor groove is differentially accessible on opposite sides of the nucleosome dyad. The two positions labeled with arrows have the same relative distance to the dyad. (Left) The blue strand faces outward and is more exposed to digestion at this position, while the red strand faces inward and is less exposed. (Right) The red strand is now the one that faces outward, while the blue strand faces inward. In other words, on opposite sides of the nucleosome dyad, each strand is exposed differently as the minor groove becomes accessible (more exposed upstream of the dyad and less exposed downstream from the dyad). (C) Posterior density of the period of oscillation, as determined by Bayesian harmonic regression. The most probable period a posteriori for each of the two different strands is ∼10.3 bp. (D) Classification ROC for 10-fold cross-validation on both our data (blue) and the data of Hesselberth et al. (2009) (purple). All test cases from the ten folds were combined to draw an overall ROC for each data set. The areas under the two ROCs are computed and presented as a bar chart (inset). (E) Example genomic region from yeast Chromosome IX in which nucleosome positions are mapped using our moving window nucleosome scoring approach. (Top) Raw DNase-seq counts in this region. Note that DNase-seq analysis has traditionally focused only on finding and exploring DHS regions, such as the one that corresponds to the strong peak of signal just to the left of coordinate 61,000 (promoter of ESL1). (Middle) Transforming the raw DNase-seq counts using an inverse hyperbolic sine function allows clearer (but still weak) patterns to be seen in nucleosome-associated DNA. (Bottom) Smoothed moving window nucleosome score on this region (blue), in comparison with the NCP score-to-noise ratios from Brogaard et al. (2012) (purple). Nucleosome positions mapped by a greedy algorithm applied to our nucleosome scores, and for comparison the NCP score-to-noise ratios, are shown beneath the nucleosome score curve.