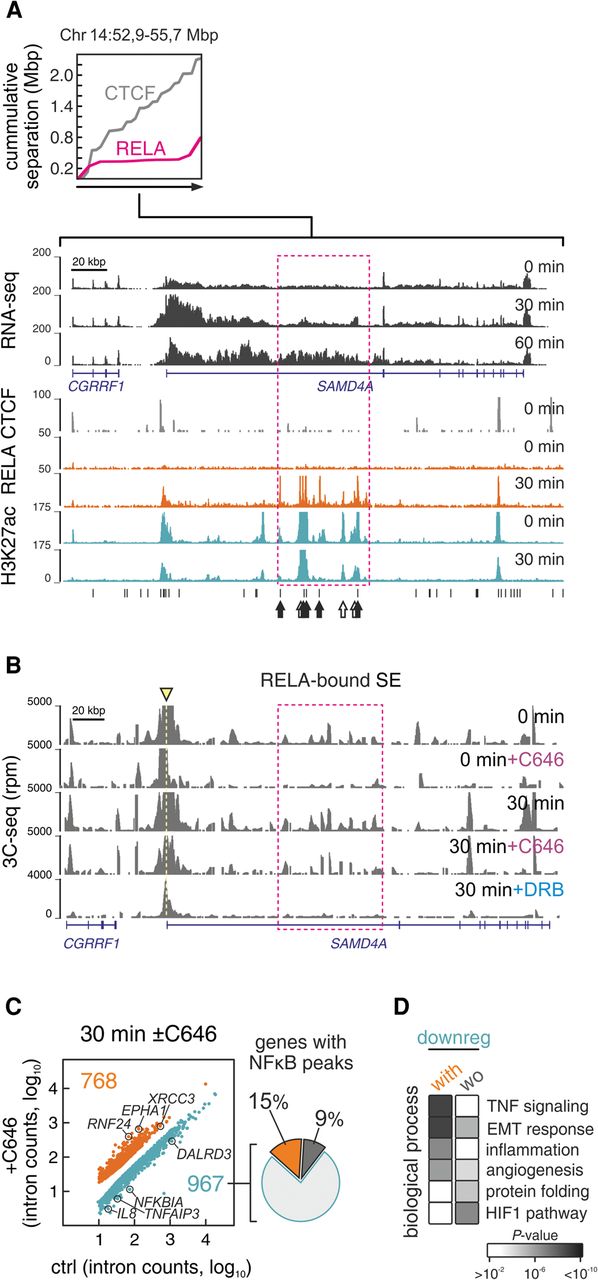
C646 treatment represses the proinflammatory expression program. HUVECs were treated with C646 for 1 h, followed by TNF stimulation for 0 or 30 min and analyzed. (A) Top: cumulative separation of RELA-bound (30 min) and CTCF peaks (0 min) in the 2.8-Mbp SAMD4A locus. (Bottom) Browser view of RNA- and ChIP-seq data (in reads per million) along SAMD4A and CGRRF1. The RELA-bound super-enhancer (magenta rectangle) and peaks “with” (black arrows) or “without” NF-κΒ motif (white arrows) are demarcated. (B) Browser view of 3C-seq data (in reads per million) generated using the SAMD4A TSS as a viewpoint (yellow triangle) at 0 and 30 min in the presence or absence of inhibitors C646 and DRB. (C) Log2-normalized mean counts of reads mapping to introns at 30 min post-stimulation in the presence or absence of C646. Only genes up- (orange) and down-regulated (blue) are shown. Pie chart: 15% and 9% of the 967 down-regulated genes associate with “with” and “without” RELA peaks, respectively. (D) The most significantly enriched GO terms (biological process) associated with C646-down-regulated genes assigned to 30-min RELA peaks “with”/”without” motifs in the same TAD.