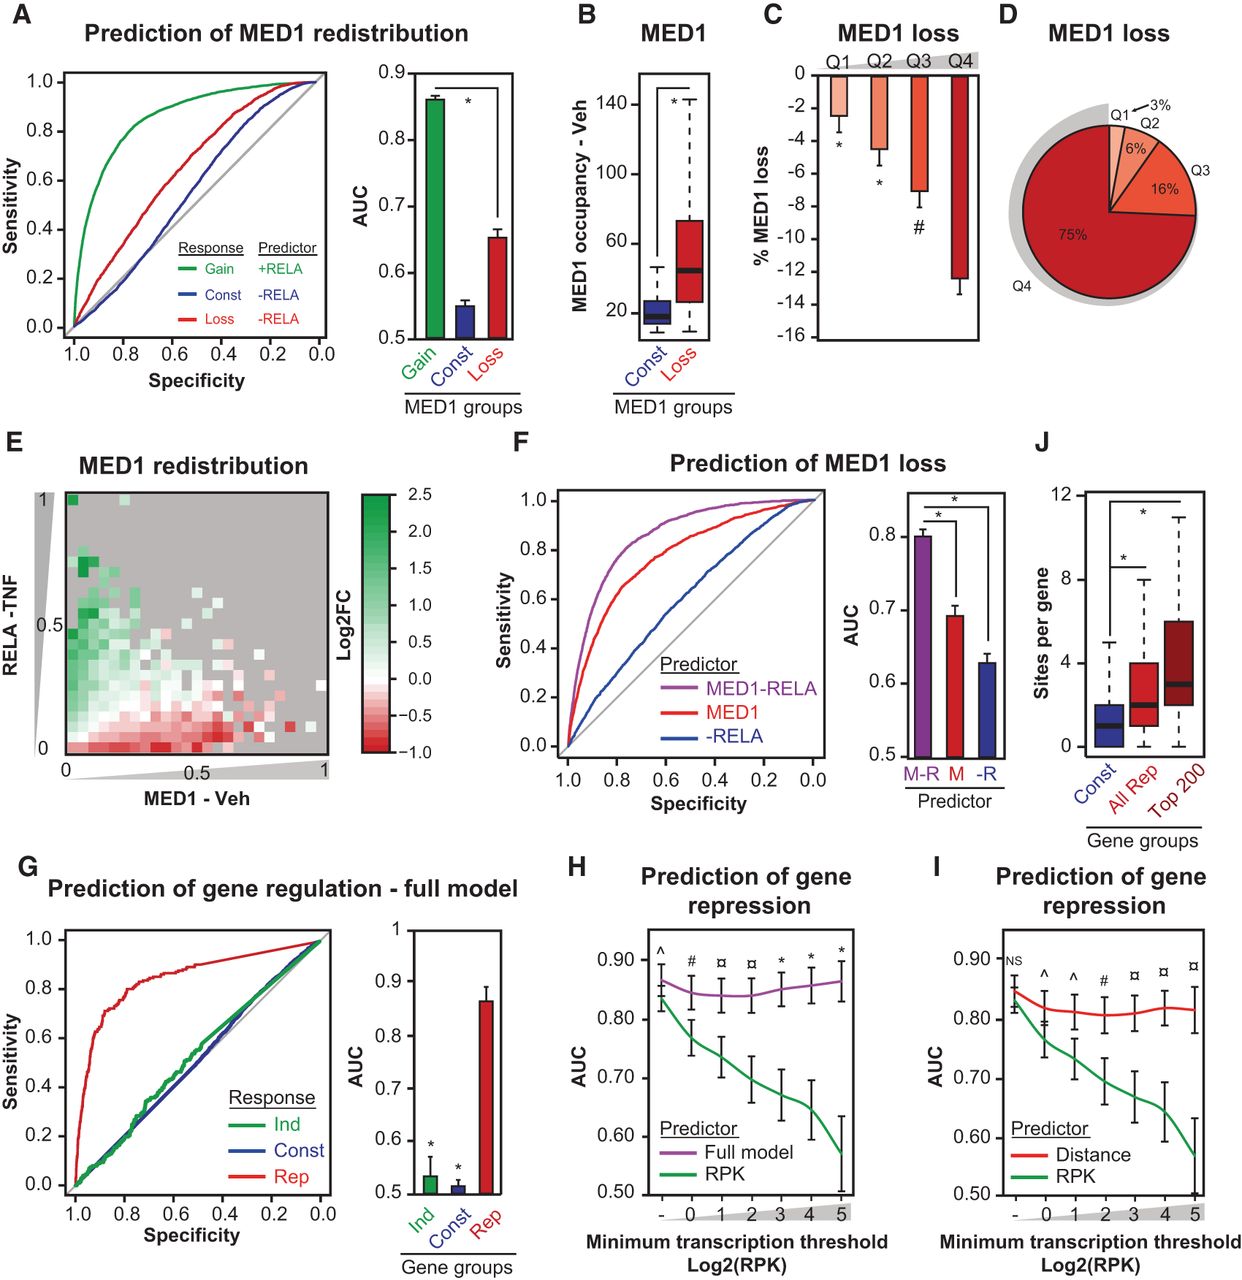
A selective redistribution model predicts gene repression by TNF. (A) Receiver operating characteristics (ROC)-curve for prediction of MED1 gain or loss (as defined in Fig. 1D) based on high and low RELA occupancy, respectively. Bar diagrams represent the AUC for each ROC-curve with error bars representing the 95% confidence interval of the AUC determined by DeLongs test. P-value: * < 2.2 × 10⁻¹⁶, determined by bootstrapping. (B) Box plot showing MED1 occupancy in vehicle-treated cells at sites that display constant occupancy or loss of MED1 upon TNF exposure. P-value: * < 2.2 × 10⁻¹⁶, Wilcoxon rank-sum test. (C) Bar diagrams representing mean % loss of MED1 following TNF exposure for MED1 sites divided into quartiles based on MED1 occupancies in vehicle-treated SGBS adipocytes. Error bars represent 95% confidence interval around the mean. P-value compared with Q4: * < 2.2 × 10⁻¹⁶, # = 5.28 × 10⁻¹², Welch's t-test. (D) Pie chart representing the fraction of total genomic MED1 tags lost originating from the four different quartiles defined in C. (E) Heat map representing mean log2 fold change in MED1 occupancy following TNF treatment for MED1 sites binned by MED1 occupancy in vehicle-treated cells (x-axis) and by RELA occupancy in TNF-treated cells (y-axis). Bins with no data are plotted in gray. (F) ROC-curves and bar diagrams representing prediction of MED1 loss as defined in Figure 1D based on RELA occupancy in TNF-treated cells (blue), MED1 in vehicle-treated cells (red), or subtracted occupancies (purple). Bar diagrams represent the AUC for each ROC-curve with error bars representing the 95% confidence interval of the AUC determined by DeLongs test. P-value: * < 2.2 × 10⁻¹⁶, DeLongs test. (G) ROC-curves for prediction of the top 200 TNF-regulated and constitutive genes as defined in Supplemental Figure 1C based on summarized distance-adjusted occupancy scores as depicted. Bar diagrams represent the AUC for each ROC-curve with error bars representing the 95% confidence interval of the AUC determined by DeLongs test. P-value compared with repressed: * < 2.2 × 10⁻¹⁶, determined by bootstrapping. (H,I) Line plots showing the dependency between minimum transcription thresholds and ROC AUCs for the prediction of the top 200 repressed genes by TNF with the “full model” (purple) (H) defined in G and a “distance model” (red) (I) based solely on summarized distance scores for each gene. Green lines represent ROC AUCs for a model using intron read densities (RPK) for prediction of repression. RPK denotes reads per kb per 10 M reads. Error bars represent the 95% confidence interval of the AUC determined by DeLongs test. P-value compared with CPM: ^ < 5.0 × 10⁻², ¤ < 5.0 × 10⁻⁴, # < 5.0 × 10⁻⁸, * < 5.0 × 10⁻¹², DeLongs test. (J) Box plots representing the number of MED1 sites in vehicle-treated cells within 50 kb of the TSS for constitutive and repressed genes. P-value: * < 2.2 × 10⁻¹⁶, Wilcoxon rank-sum test.