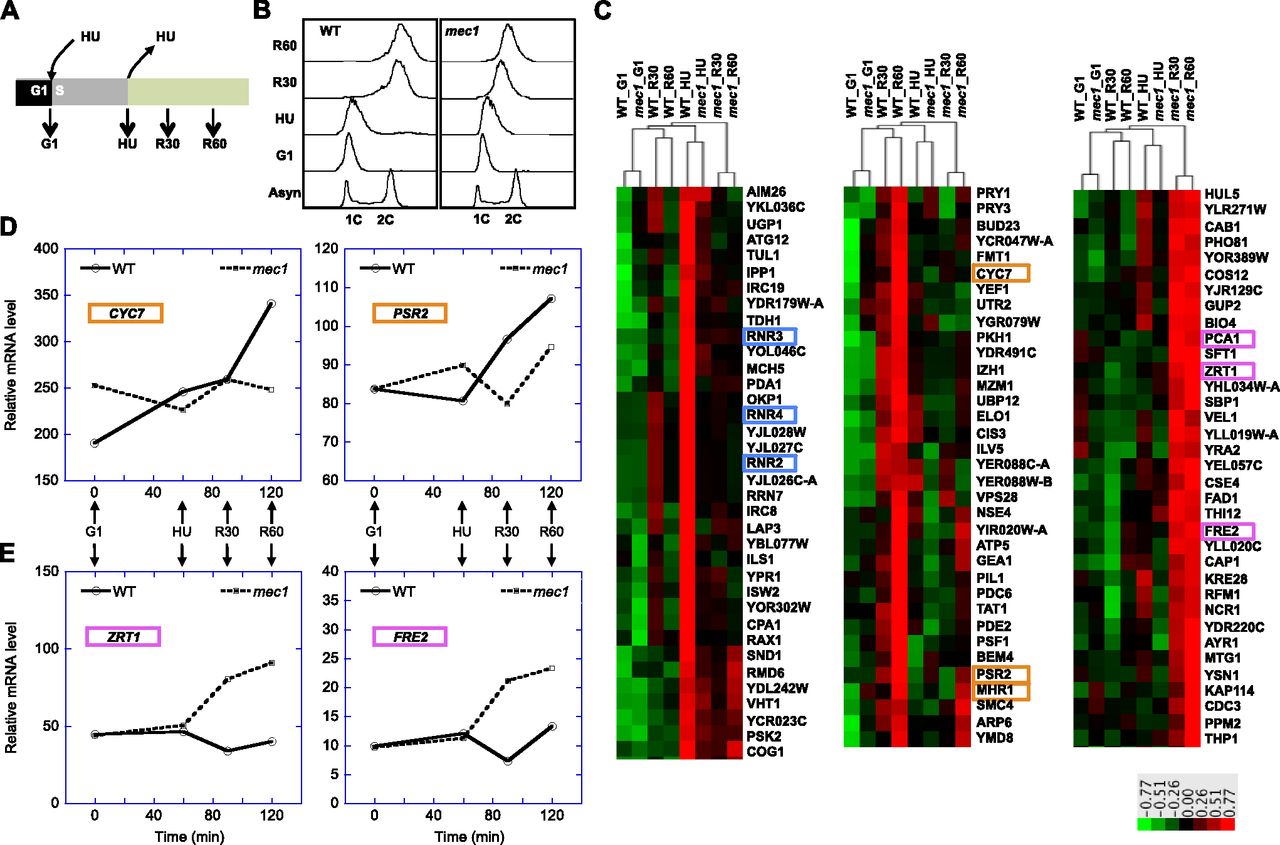
RNA-seq analysis. (A) Illustration of sample collection: (G1) α-factor arrested; (HU) exposed to HU for 1 h; (R30 and R60) recovery from HU for 30 and 60 min, respectively. (B) Cell cycle progression by FACS. (Asyn) Log phase culture prior to cell cycle synchronization. (C) Selected clusters of gene expression patterns in MEC1 (WT) and mec1 cells. Color bar values indicate log10 transformed values of normalized RPKM read count. The three panels represent growth phase- and strain-specific gene expression patterns. Selected genes in each cluster are boxed for emphasis and color-coded for the functional groups. (Left) HU-specific and Mec1-dependent (e.g., DNA damage response genes in blue boxes); (middle) Recovery-specific in WT cells (e.g., stress-response genes in orange boxes); (right) Recovery-specific in mec1 cells (e.g., metal ion transporter genes in purple boxes). Gene expression profiles for selected Recovery-specific genes in WT (D) and mec1 (E) cells from the cluster analysis are shown. The times at which the samples were taken are labeled on the time scale on the x-axes.