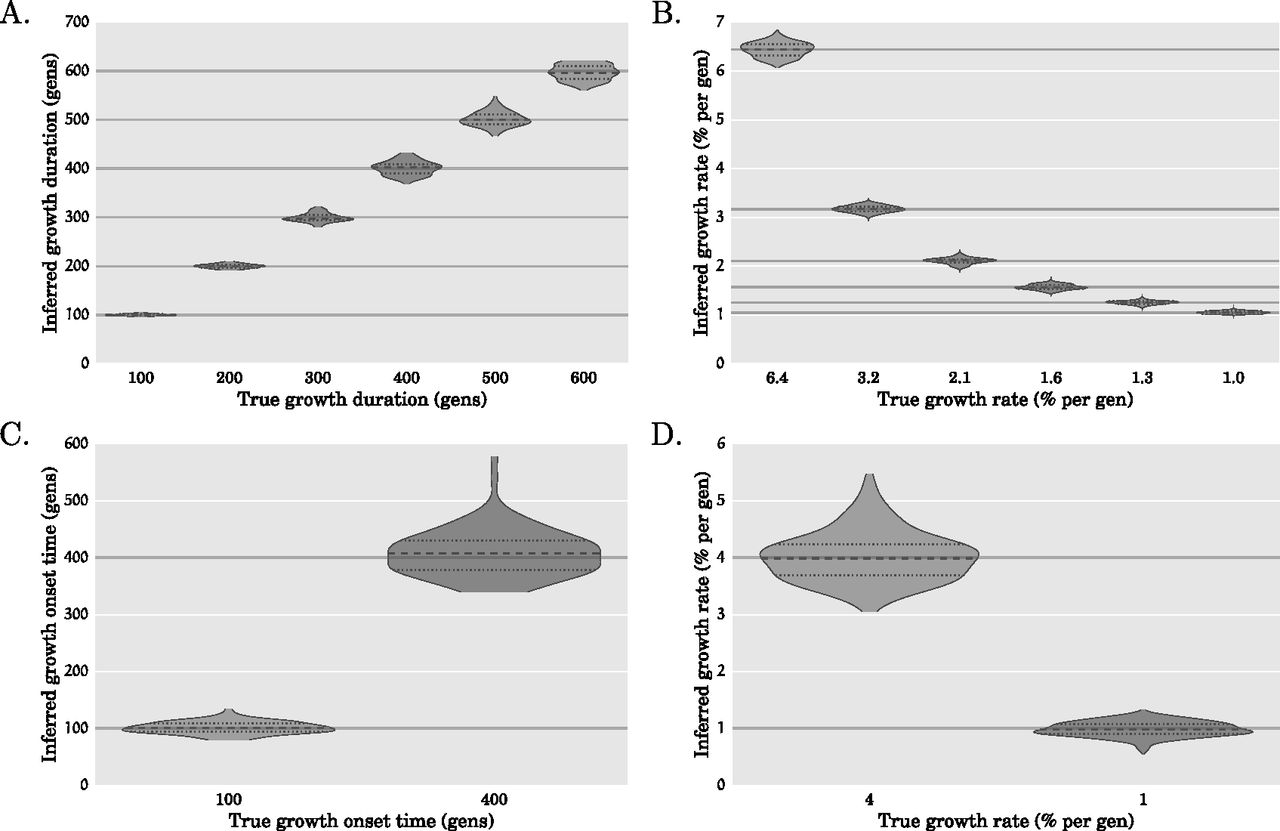
Performance of our method on simulated data. Each violin plot is generated using 100 simulated data sets with 100 unlinked loci of 10 kb each over 10,000 diploid individuals. The gray solid horizontal lines indicate the true values for the simulation parameters. The median inferred parameter values, indicated by dashed black lines, match the true parameter values very well. Panels A and B, respectively, show violin plots of the duration and rate of exponential growth in the population size for each of the six simulation parameter settings of Scenario 1, illustrated in Figure 1A. Panels C and D show violin plots of the onset times (t1 and t2) and exponential growth rates (r1 and r2) for the two epochs of exponential growth in Scenario 2, illustrated in Figure 1B.