Figure 1.
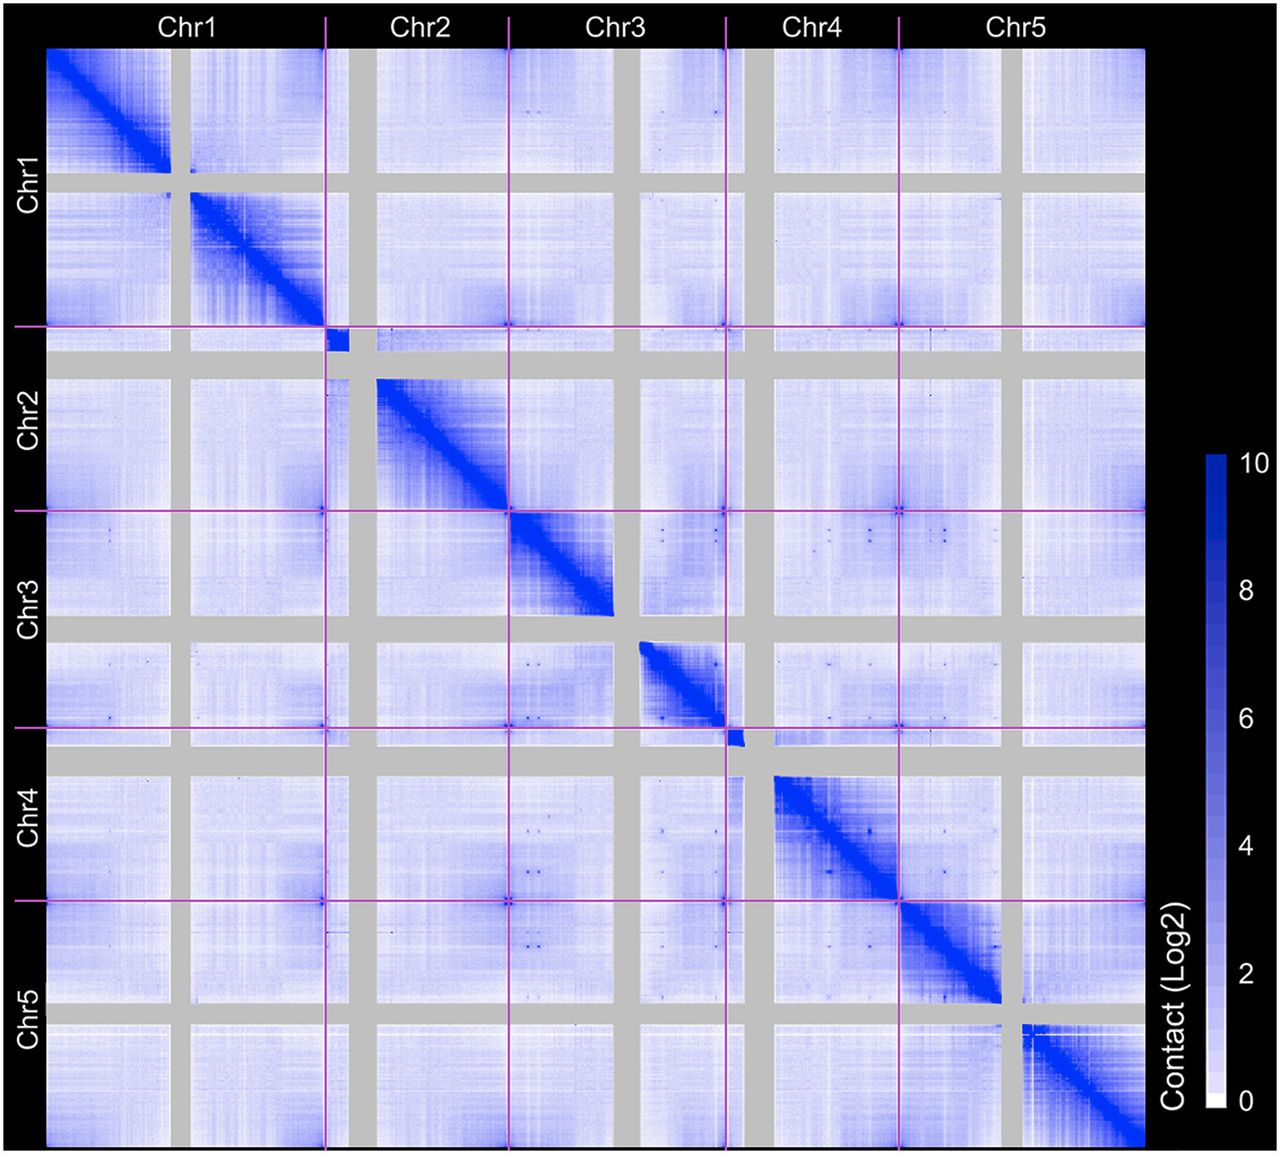
Genome-wide interaction map of A. thaliana at 20-kb resolution. Elements represent normalized contact strength. Centromeric regions are masked.
Genome-wide interaction map of A. thaliana at 20-kb resolution. Elements represent normalized contact strength. Centromeric regions are masked.