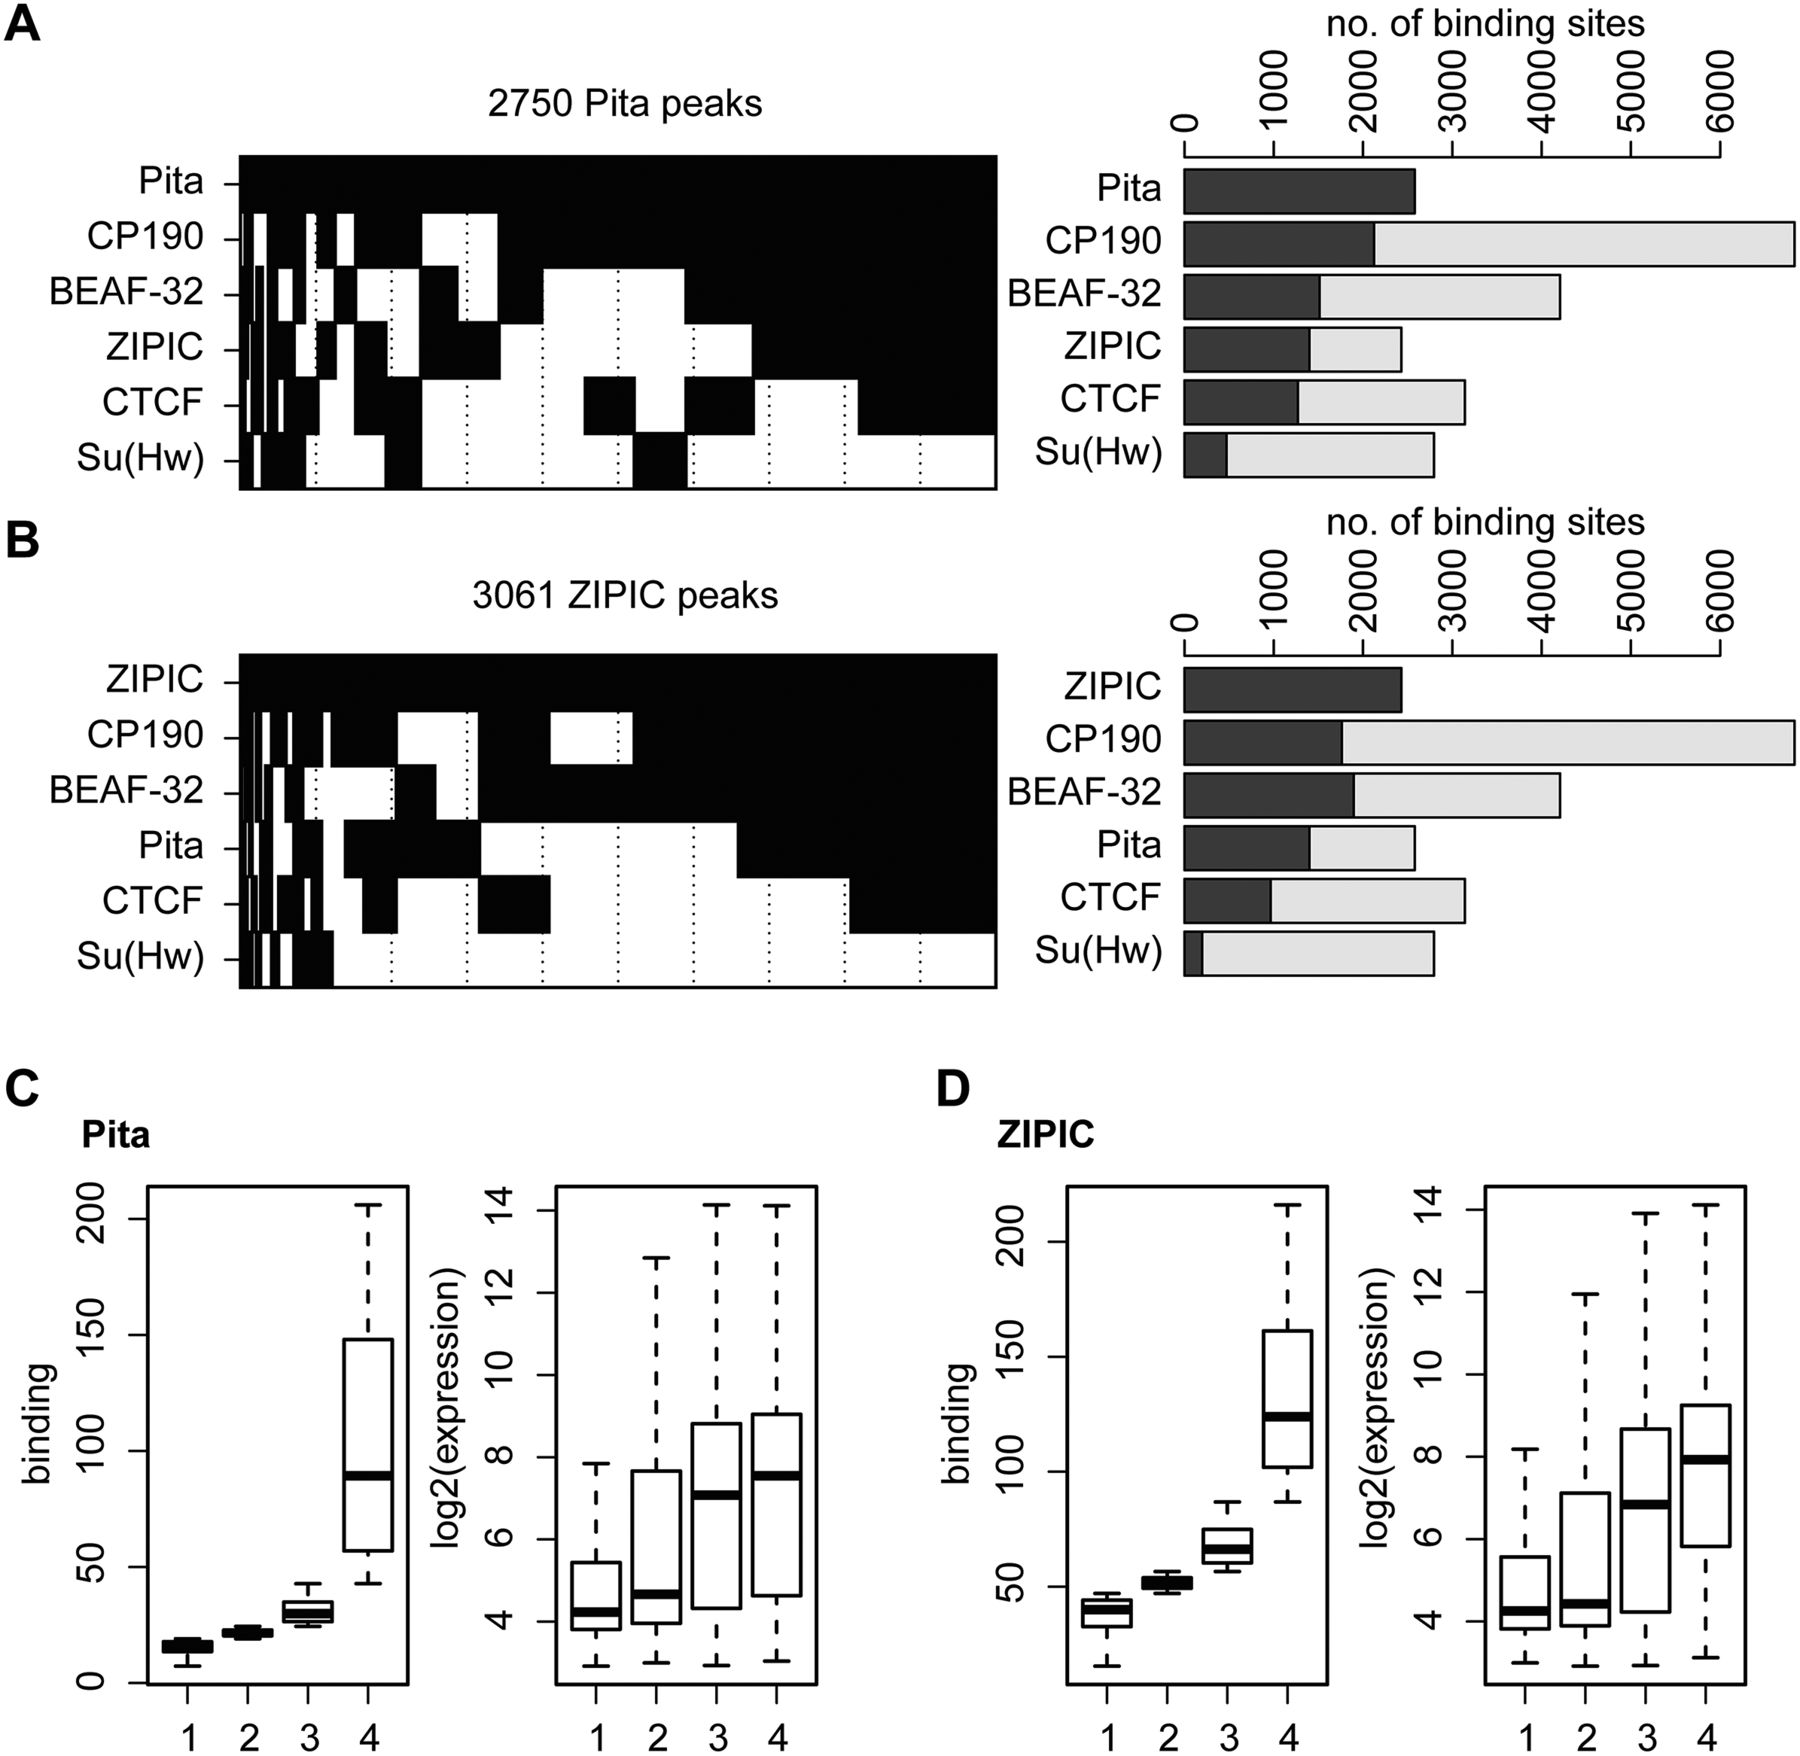
Pita and ZIPIC binding sites cluster with insulator factors. (A,B) Binary heat maps of (A) Pita and (B) ZIPIC binding sites classified into groups on the basis of their overlap with the binding of CP190, BEAF, dCTCF and Su(Hw). All sites bound by at least one of these factors are plotted (2579 sites for Pita and 2429 sites for ZIPIC). Each group is shown as a black rectangle in the corresponding row, and each column corresponds to a certain genomic location. The sites are sorted with respect to the occurrence frequency of a given binding pattern. The corresponding bar plot shows for each row the total number of peaks overlapping with the respective factor (dark gray). Additionally, the fraction of peaks not overlapping with Pita (A) or ZIPIC (B) is plotted in light gray. (C,D) For all RefGene transcription units, the maximum coverage for Pita (C) and ZIPIC (D) was calculated within a ±1-kb interval around the transcription start site, and the units were sorted accordingly into four groups, from (1) weak to (4) strong binding (left boxplot). The corresponding gene expression levels are shown in the right boxplot.