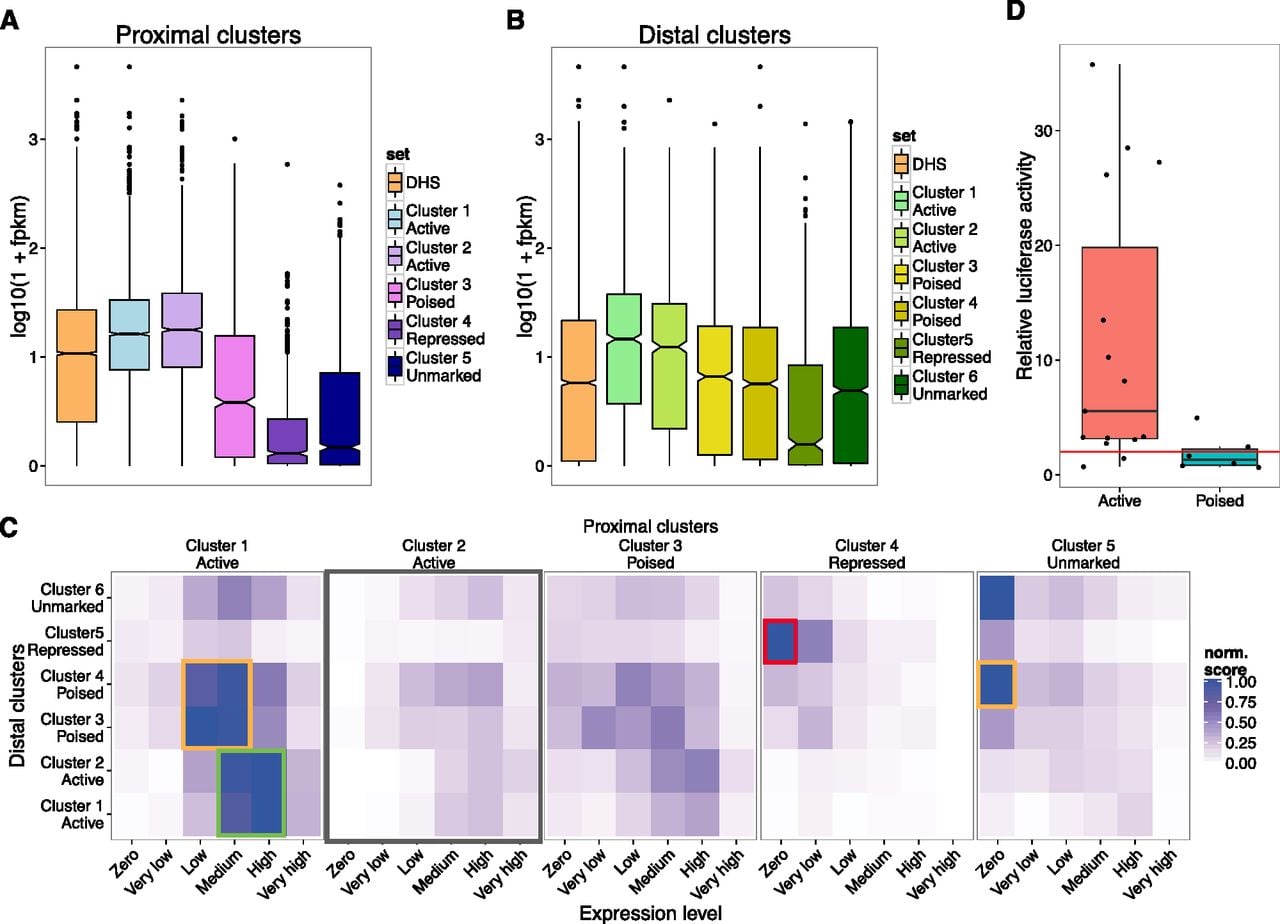
DHS clusters exist in a range of activity states. (A,B) Boxplots of the expression levels (RNA-seq) of the genes associated with proximal (A) and distal (B) DHS clusters. (C) Heatmap showing the strength of association between each class of distal DHS cluster (y-axis) and each proximal cluster (x-axis). Proximal cluster-associated genes have been further subdivided according to their expression level. Enrichment values are row-normalized and represent the P-values as calculated by GREAT (see Methods). Active distal elements are strongly enriched around expressed genes with active proximal elements (green box). Poised enhancers associate with less expressed or nonexpressed genes (yellow boxes), and repressed enhancers are most enriched around repressed promoters of silent genes (red box). Active proximal cluster 2 elements are weakly associated with all distal DHS classes. (D) Increased luciferase activity is driven by active (distal cluster 1 and 2) compared to poised (distal cluster 3 and 4) enhancers. Values presented are the fold change in normalized luciferase signal compared to the enhancerless parent vector containing only a minimal promoter.