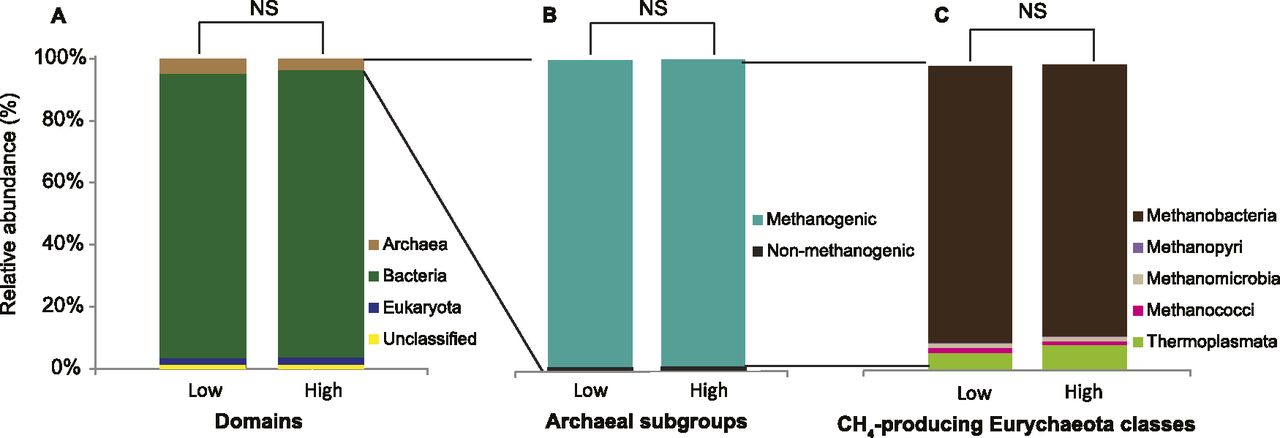
Figure 2.
Comparison of relative abundance of different microbial populations in low and high CH4 yield sheep. (A) Relative abundance of microbial domains in low and high CH4 yield sheep. (B) Relative abundance of methanogenic and nonmethanogenic archaea in low and high CH4 yield sheep. (C) Relative abundance of classes of CH4-producing Euryarchaeota in low and high CH4 yield sheep. (NS) No statistical difference in Wilcoxon rank-sum test in each subgroup.