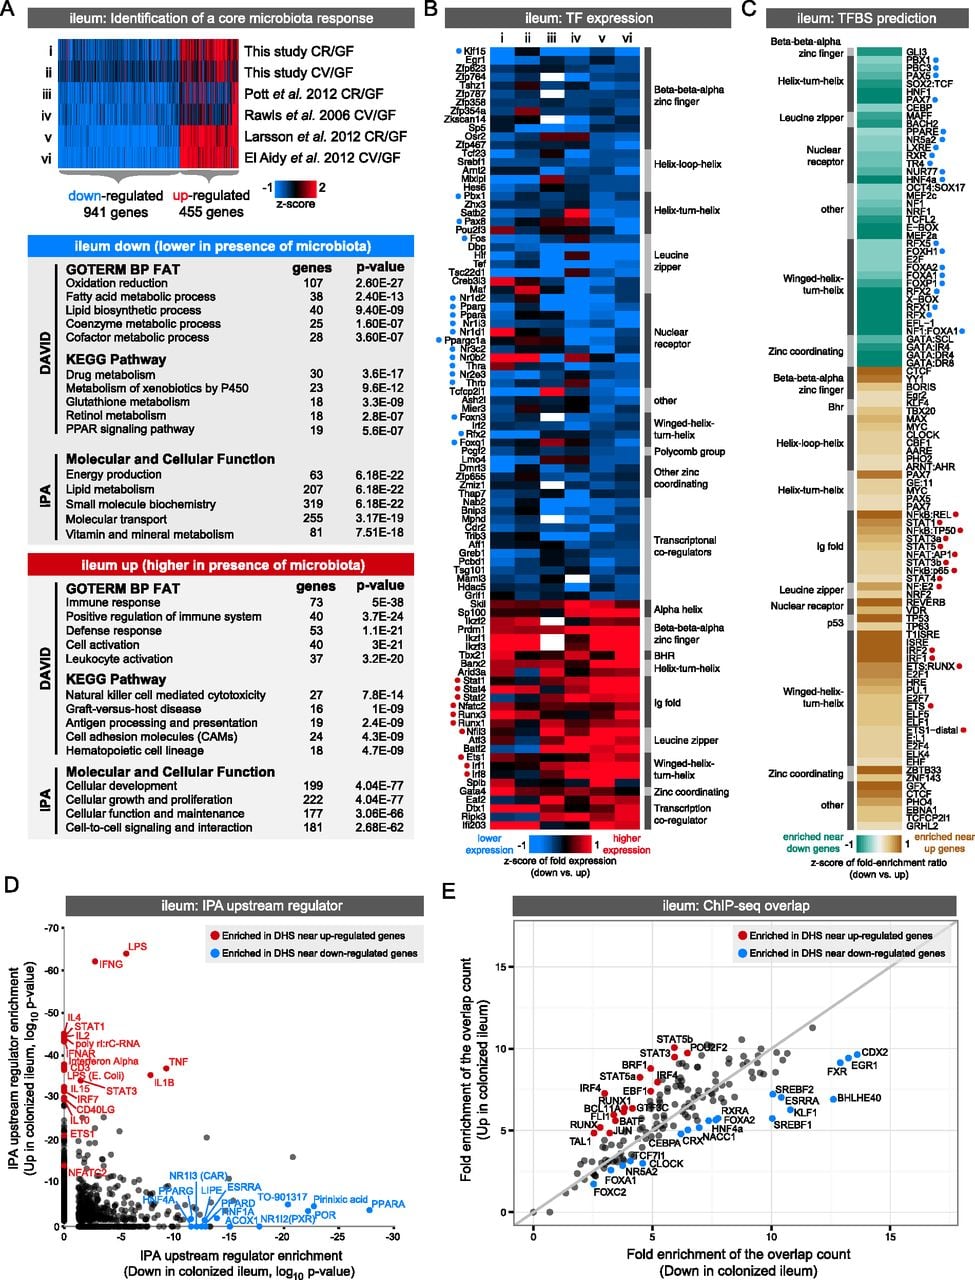
Integrating gene expression and open chromatin data identifies candidate transcription factors regulating response to microbiota colonization in the ileum. (A) Integration of our data set with published studies comparing ileum gene expression in the presence and absence of microbiota reveals a set of genes consistently up- or down-regulated by microbiota across at least four studies. Significant functional enrichments are shown for each gene set (see Supplemental Fig. S9; Supplemental Table S11). (B) Heat map of known transcription factors (TFs; including DNA binding transcription factors and transcription cofactors) that consistently display differential RNA expression levels in response to microbiota across multiple experimental studies in the ileum. Relative expression levels are indicated, where white represents no data. TFs are annotated with their predicted DNA binding domain family. Highlighted with blue or red circles are TFs with motif (C) or binding support (E). (C) Transcription factor binding site (TFBS) prediction in DHSs within the regulatory domain of genes consistently differentially regulated by microbiota in the ileum (see Supplemental Tables S12, S13). Fold enrichments were calculated relative to a GC matched background (Guturu et al. 2013). Motifs are colored based on fold enrichment ratios between down and up gene sets. (Teal) Enriched in DHSs near down genes; (brown) enriched in DHSs near up genes. Highlighted with blue or red circles are motifs matching TFs with differential expression (B) or binding support (E). (D) Scatter plot showing P-values for IPA upstream regulator analysis for the ileum up and ileum down gene lists identifies TFs and other factors that have previously been shown to influence expression of genes within these lists. (E) Plot showing the overlap of ChIP-seq peaks from multiple TFs (measured in various tissues) (see Supplemental Table S14) with DHSs within the regulatory domain of genes either consistently up-regulated (y-axis) or down-regulated (x-axis) by microbiota in the ileum. Fold enrichments were calculated relative to a uniformly distributed null model. Highlighted are the TFs where the up/down fold ratio is at least one standard deviation away from the mean of all fold ratios.