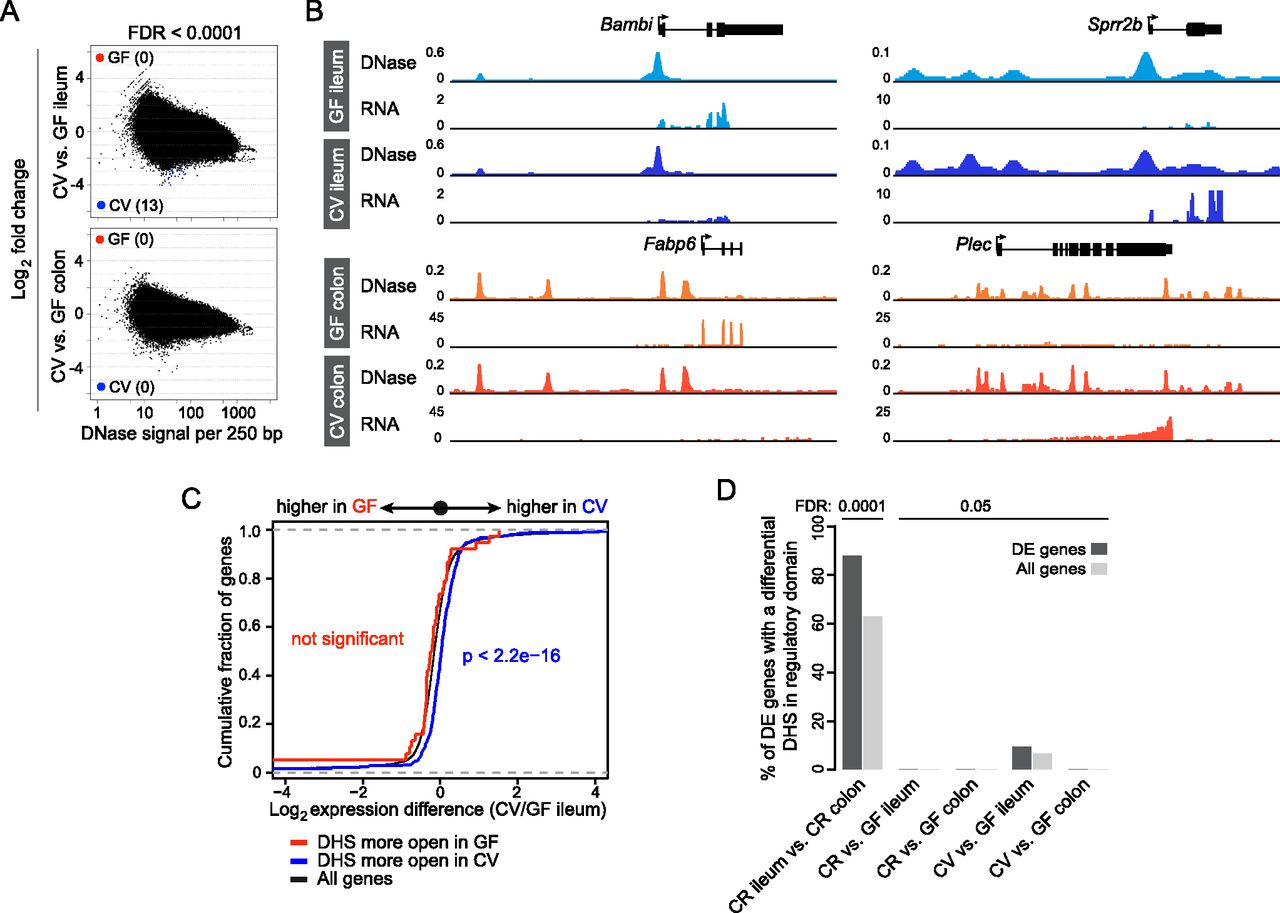
Microbiota do not substantially remodel the intestinal epithelial chromatin landscape upon acute colonization. (A) The fold difference in DNase signal intensity from conventionalized (CV) versus germ-free (GF) ileal or colonic IECs plotted against the average DNase signal observed in 250-bp windows. Significantly differential windows are highlighted in red and blue (FDR < 0.0001). (B) Representative signal track highlighting multiple genes in the ileum or colon that show differences in transcript abundance upon colonization with microbiota but no detectable change in the open chromatin landscape. (Bambi) BMP and activin membrane-bound inhibitor; (Sprr2b ) small proline-rich protein 2B; (Fabp6) fatty acid binding protein 6; (Plec) plectin. See also Supplemental Tables S3 and S7. (C) Two-sided Kolmogorov-Smirnov goodness-of-fit test shows a weak relationship between the presence of a nearby tissue-specific DHS (within 2 kb of the gene body) and increased transcript abundance in the GF versus CV ileum comparison at FDR < 0.05. The y-axis shows the cumulative fraction of genes linked to a nearby tissue-specific DHS. Deviation from the null expectation that linked genes display a normal distribution centered on a fold change of 1 (black line) suggests that CV-specific DHSs are enriched near genes of higher expression in CV ileal IECs. (D) Percent of differentially expressed genes that have a differential DNase hypersensitive site within their regulatory domain at two cutoffs (FDR < 0.0001 and FDR < 0.05). See also Supplemental Figure S7 and Supplemental Table S8.