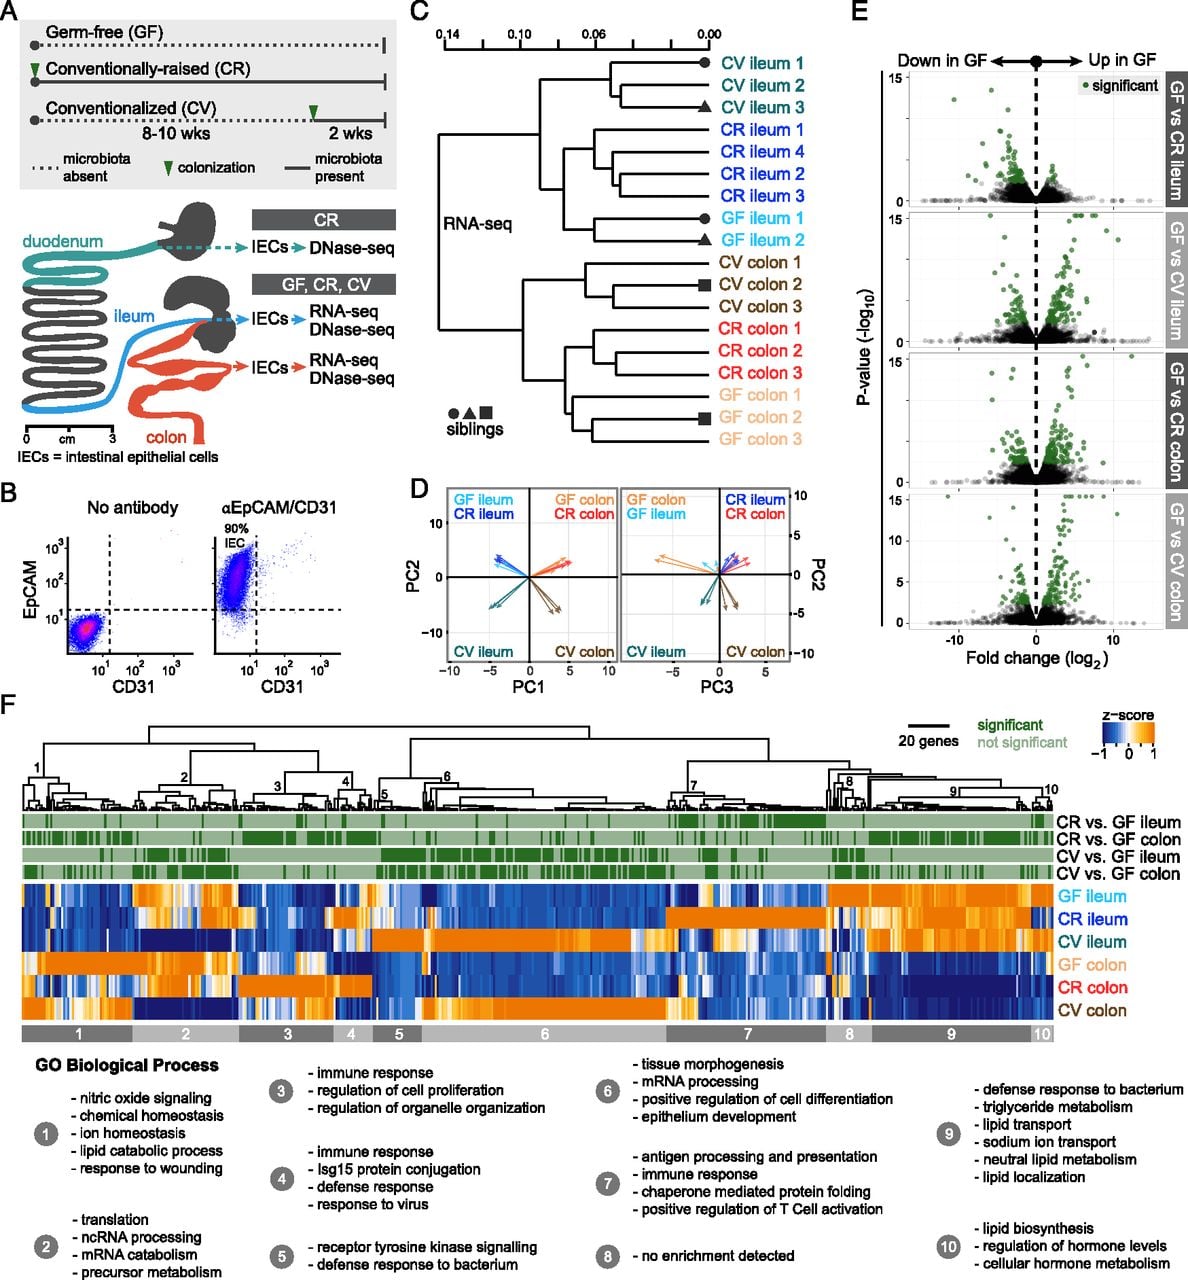
RNA-seq reveals transcriptome alterations in the presence and absence of microbiota in the mouse ileal and colonic epithelium. (A) Overview of experiments described in this study. Schematic of the mouse gastrointestinal tract showing the stomach (dark gray), duodenum (teal), jejunum (dark gray), ileum (blue), cecum (dark gray), and colon (red). Adapted from Stevens (1977). © 1933 by H.H. Dukes; © 1977 by Cornell University. Used by permission of the publisher, Cornell University Press. Approximately 6-cm sections of the duodenum, ileum, or colon were used for intestinal epithelial cell (IEC) isolation (see Methods). DNase-seq and RNA-seq were performed on intestinal epithelial cells (IECs, ∼90% purity) isolated from the ileum and colon of germ-free (GF), conventionally raised (CR), and ex-GF conventionalized (CV) mice. DNase-seq was also performed on IECs isolated from the duodenum of CR mice. (B) Fluorescence-activated cell sorting of pooled duodenal and ileal IECs labeled with antibodies marking either epithelial cells (EpCAM) or endothelial cells/leukocytes/platelets (CD31) reveal that ∼90% of cells were epithelial (EpCAM positive and CD31 negative). Similar results were obtained from colonic IEC preparations (data not shown). (C) Dendrogram of Jensen-Shannon divergence shows that RNA-seq replicates from GF, CR, or CV ileal or colonic IECs cluster. Note that anatomical location and environmental condition, rather than sibling relationship, drives the clustering. (D) Principal component analysis (PCA) confirms tissue type (PC1) and colonization state (PC2 and PC3) explains much of the variance observed in the RNA-seq data. Arrow tips denote sample position in PCA coordinates. (E) Volcano plot showing pairwise comparisons of RNA expression between GF versus CR and GF versus CV conditions for each tissue. Green dots represent genes that are significantly different (FDR < 0.05). (F) Hierarchical clustering of FPKM values for all genes that exhibited differential expression in the pairwise comparisons in D. Gene clusters were submitted to DAVID to determine Gene Ontology functional enrichment. Shown are top enrichments for each gene cluster. See also Supplemental Tables S1, S3, and S4.