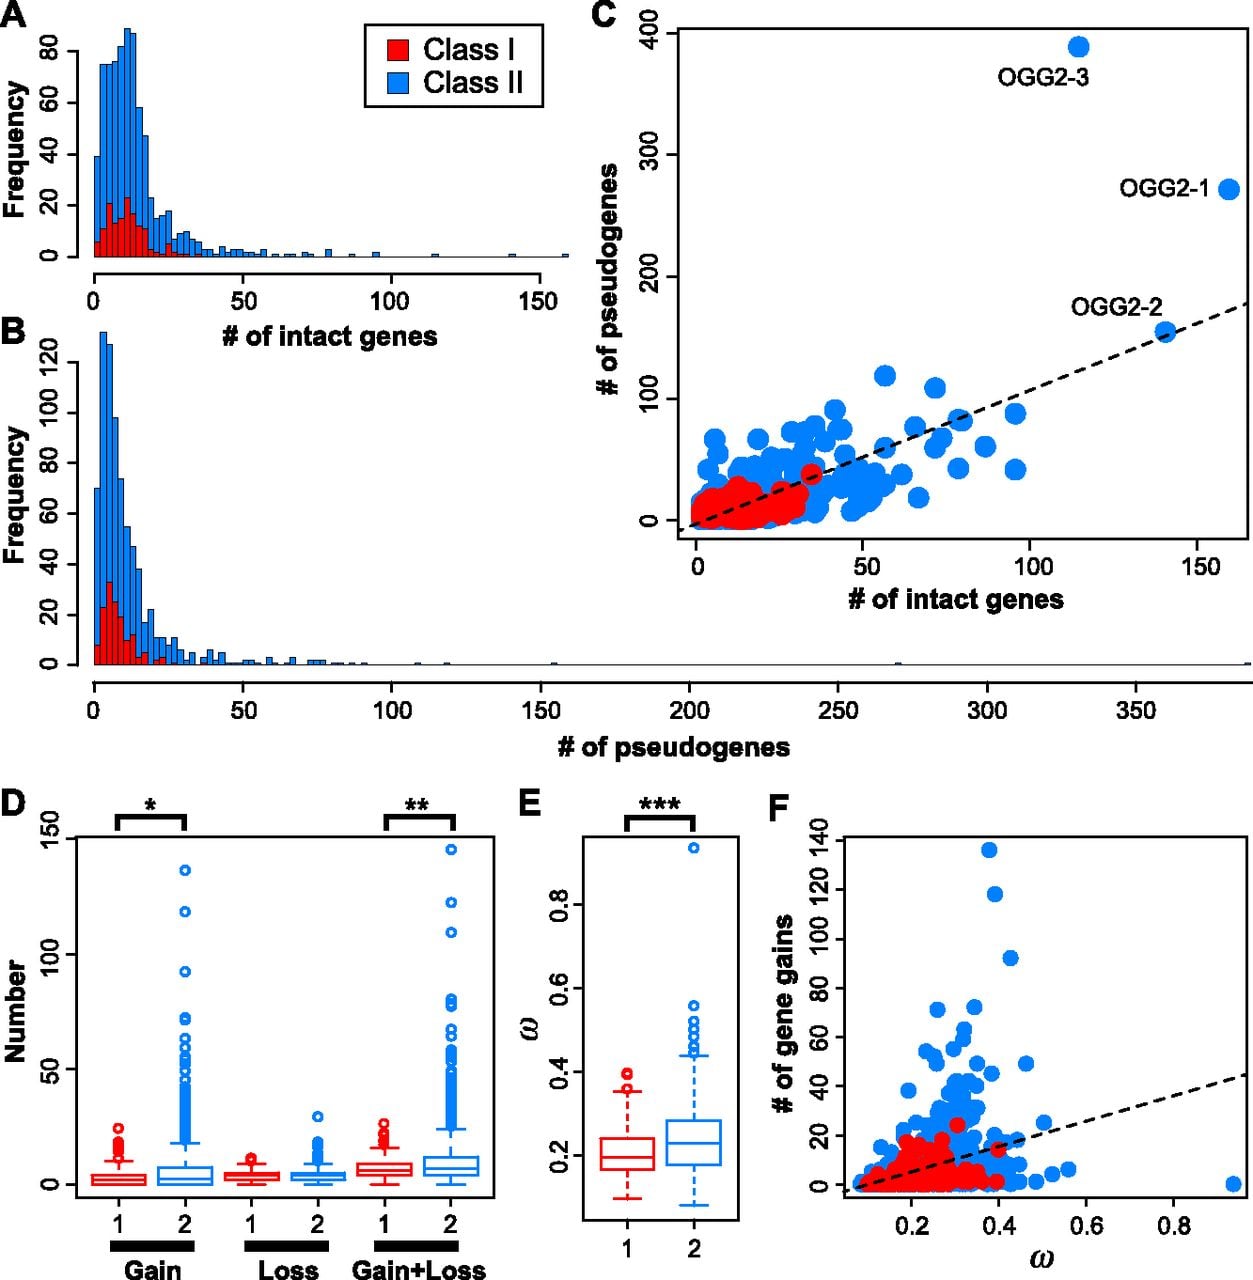
Distribution of the total number of OR genes—(A) intact genes and (B) pseudogenes—belonging to each of the 781 OGGs found among 13 placental mammal species. Red and blue indicate Class I and Class II genes, respectively (A–F). (C) The number of intact genes was positively correlated with the number of pseudogenes belonging to the respective OGG (r = 0.731); the dashed line indicates the regression line. (D,E) Boxplots of comparison between Class I (“1”; red) and Class II (“2”; blue) OGGs for estimated numbers of gene gains and losses (D) and estimated ω values (E). (*) P < 0.05, (**) P < 0.01, and (***) P < 0.001. (F) The ω value for an OGG was positively correlated with the number of intact genes in the respective OGG (r = 0.346; P < 2.2 × 10⁻¹⁶); the dashed line indicates the regression line.