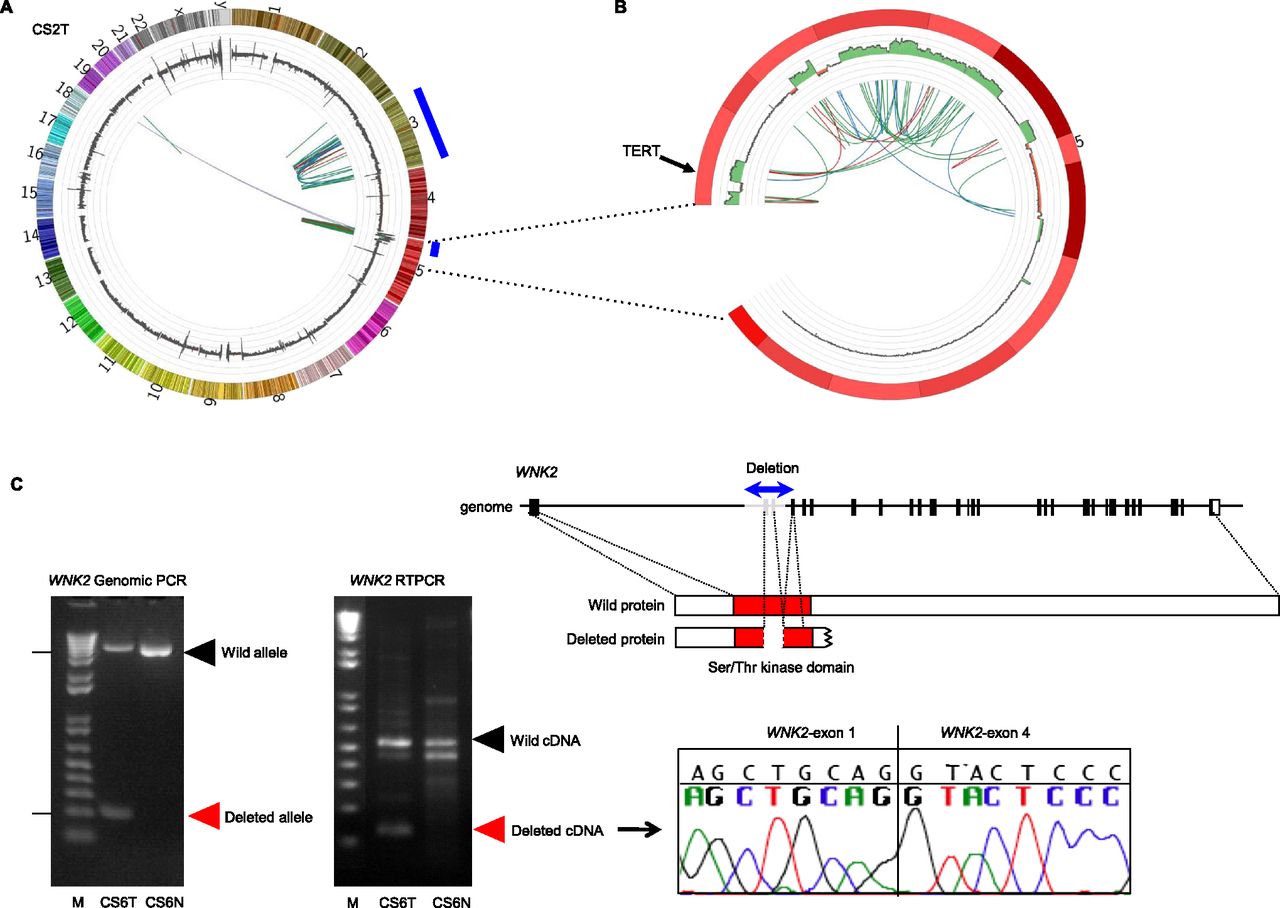
Structural alterations in chondrosarcoma. (A) Complex rearrangements in CS2T indicated by a Circos plot (Krzywinski et al. 2009). Structural alterations (red line, deletion; green line, inversion; blue line, tandem duplication; purple line, translocation) are shown in the inner circle. Copy number changes (green, copy gain/amplification; red, copy loss) are shown in the outer circle. Thick blue lines indicate regions of localized accumulation of structural alterations. (B) Massive structural alterations in the short arm of chromosome 5 in CS2T. The location of the TERT gene is indicated by an arrow. (C) Interstitial deletion in the WNK2 gene in CS6T. (Top) Schematic representation of exon 2–3 deletion in the WNK2 gene and its protein product. (Bottom left) Validation of the predicted deletion by genomic PCR and RT-PCR. (Bottom right) Sanger sequencing validation of the exon 2-3 deleted transcript.