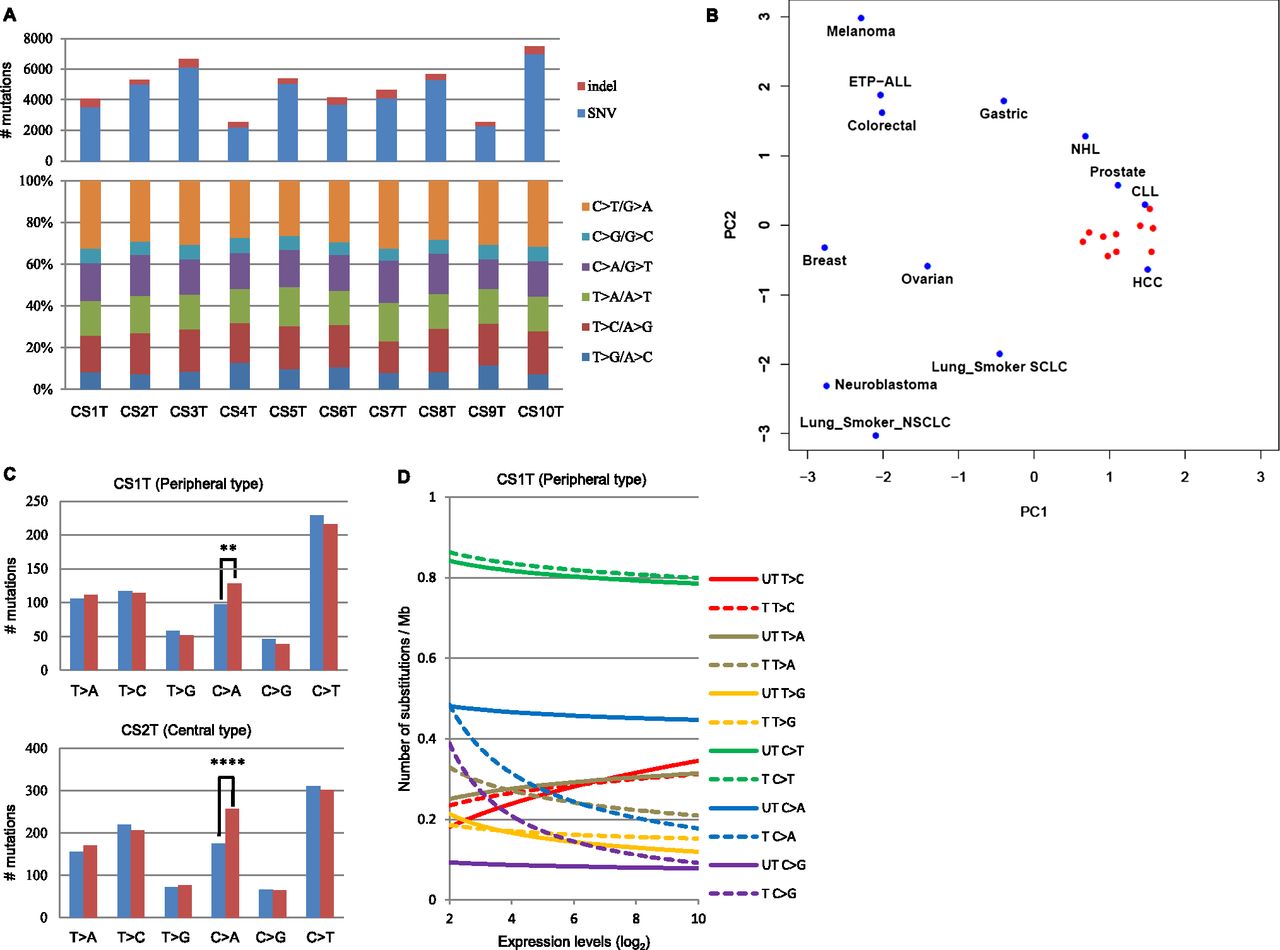
Somatic mutation signature of chondrosarcoma. (A, upper panel) Number of somatic substitutions and indels in 10 chondrosarcoma cases. (Lower panel) Percentage of six somatic substitutions in each case. (B) Principal component analysis of six substitution patterns in various cancer genomes including chondrosarcoma. Red dots indicate each chondrosarcoma case from the present study. (C) Number of somatic substitutions on transcribed (blue) and untranscribed (red) strands. A significant reduction of C>A substitution was noted on the transcribed strand. (**) P < 0.01; (****) P < 0.0001. (D) Negative correlation between number of C>A substitutions on the transcribed strand and gene expression level. (Blue) C>A substitution; (solid line) untranscribed strand; (dotted line) transcribed strand.