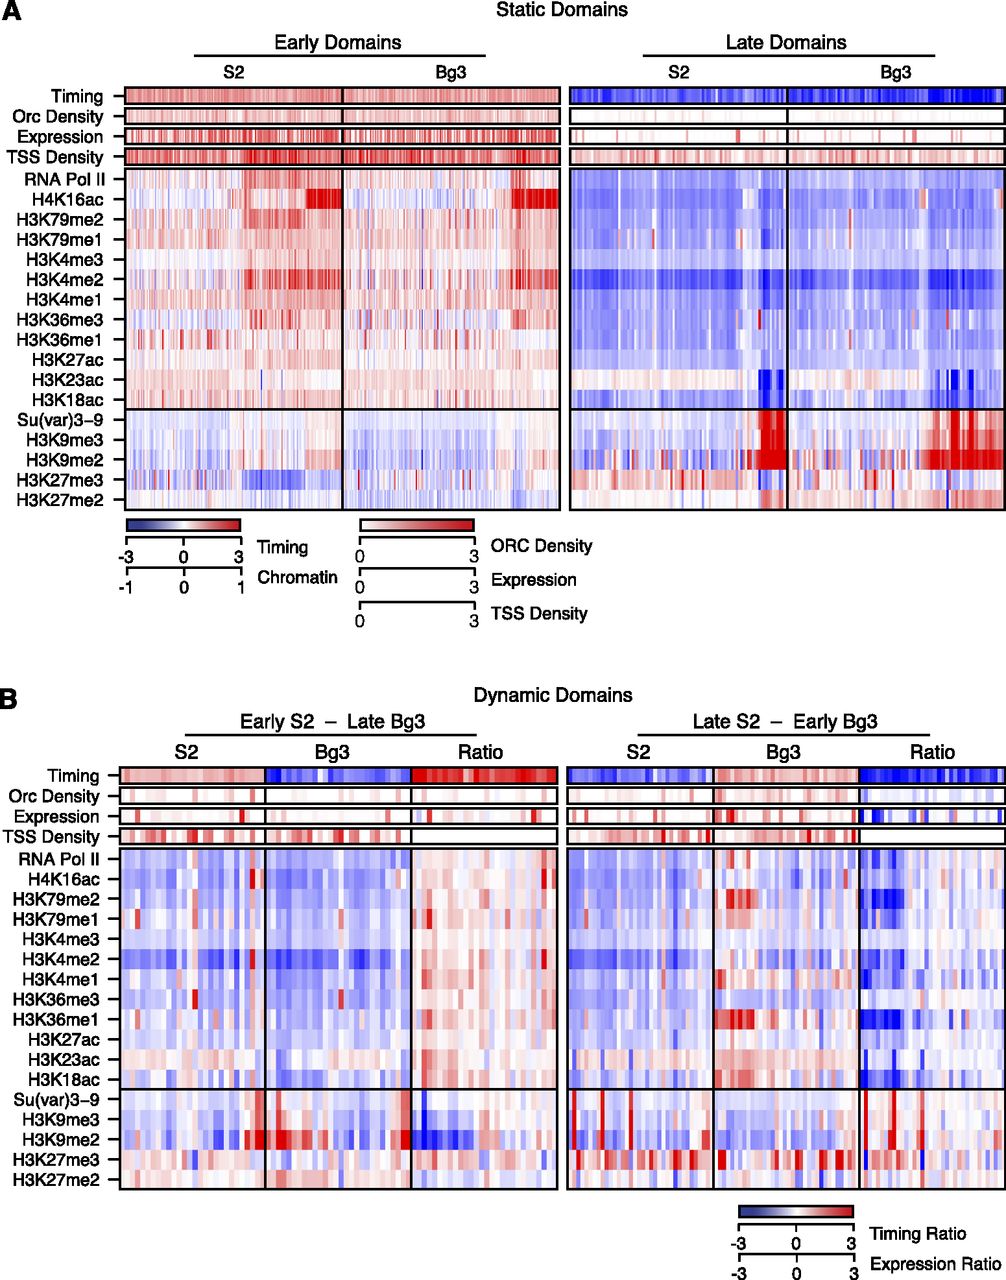
The chromatin environment defines early and late replication domains. (A) Static replication domains. The chromatin landscapes for static early (left) and late (right) domains for S2 and DmBg3 (Bg3) cells are shown. For each domain (columns), the median score for 15 histone modifications and two DNA-binding proteins were determined across the domain region, grouped into three clusters (via k-means analysis), and plotted along with the replication timing ratio (log2 difference in RPKM between early and late fractions), normalized expression, and ORC and TSS density (counts per 10 kb). The row order is the same as in Figure 2. (B) Dynamic replication domains. Same as in A, but grouped into those that switch from early in S2 to late in DmBg3 (left) or those that switch from late in S2 to early in DmBg3 (right). The difference ratio (S2/DmBg3) for each feature is also represented. Each panel is grouped (via k-means clustering) according to the difference in chromatin marks for differentially early or late replicating regions.