Figure 4.
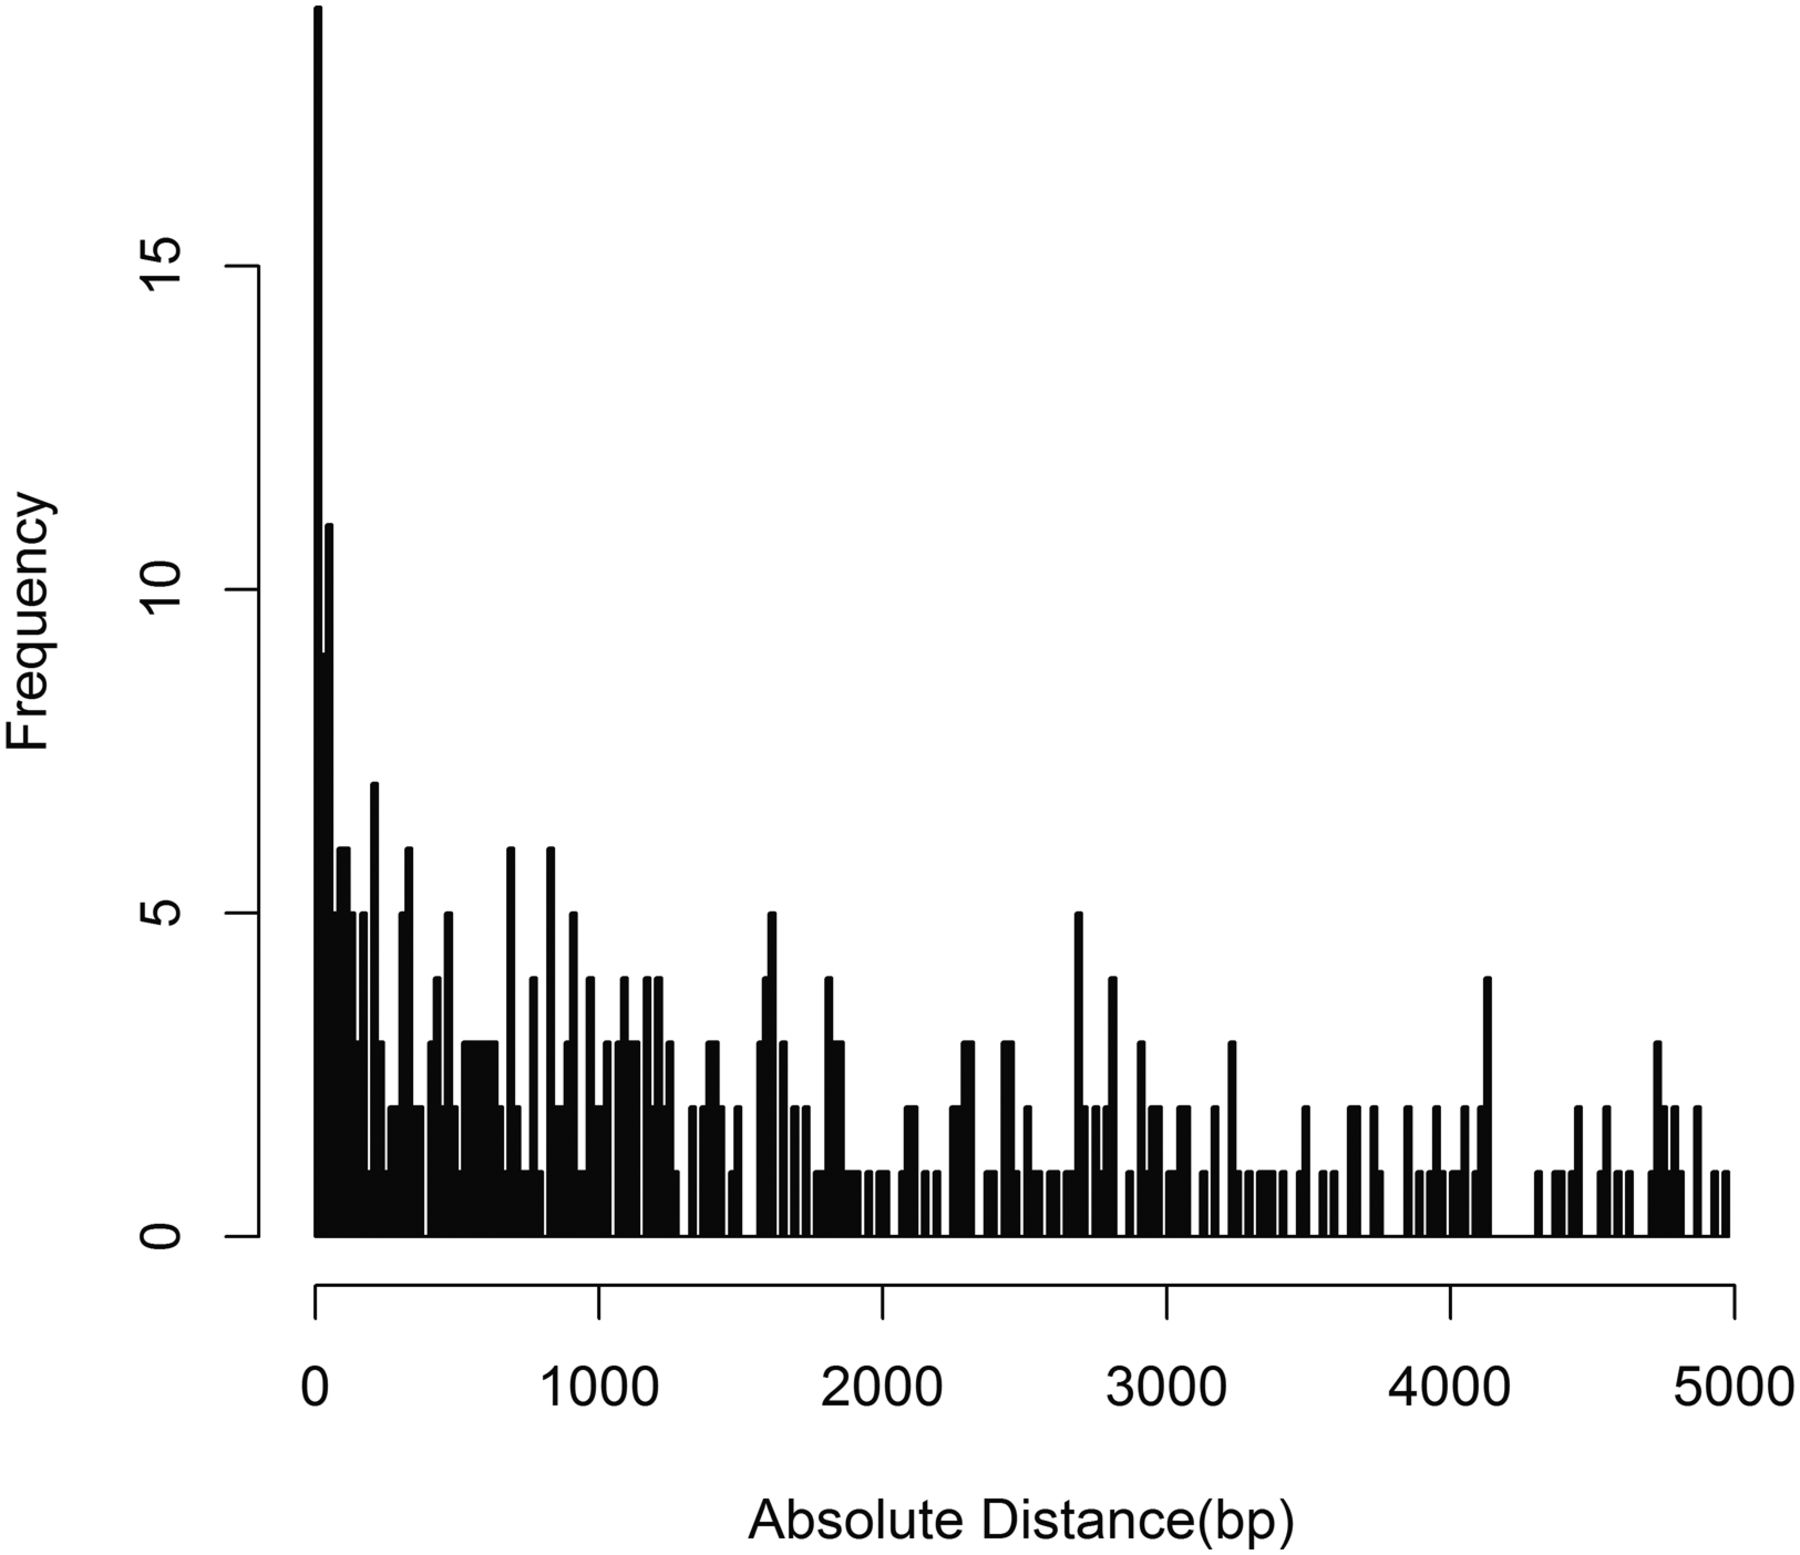
Cis pairs tend toward short distances between the SNP and CpG. Bar chart of –log10 of the P-value (y-axis) against the chromosomal distance between the SNP and CpG (x-axis) for cis pairs within 5 kb.
Cis pairs tend toward short distances between the SNP and CpG. Bar chart of –log10 of the P-value (y-axis) against the chromosomal distance between the SNP and CpG (x-axis) for cis pairs within 5 kb.