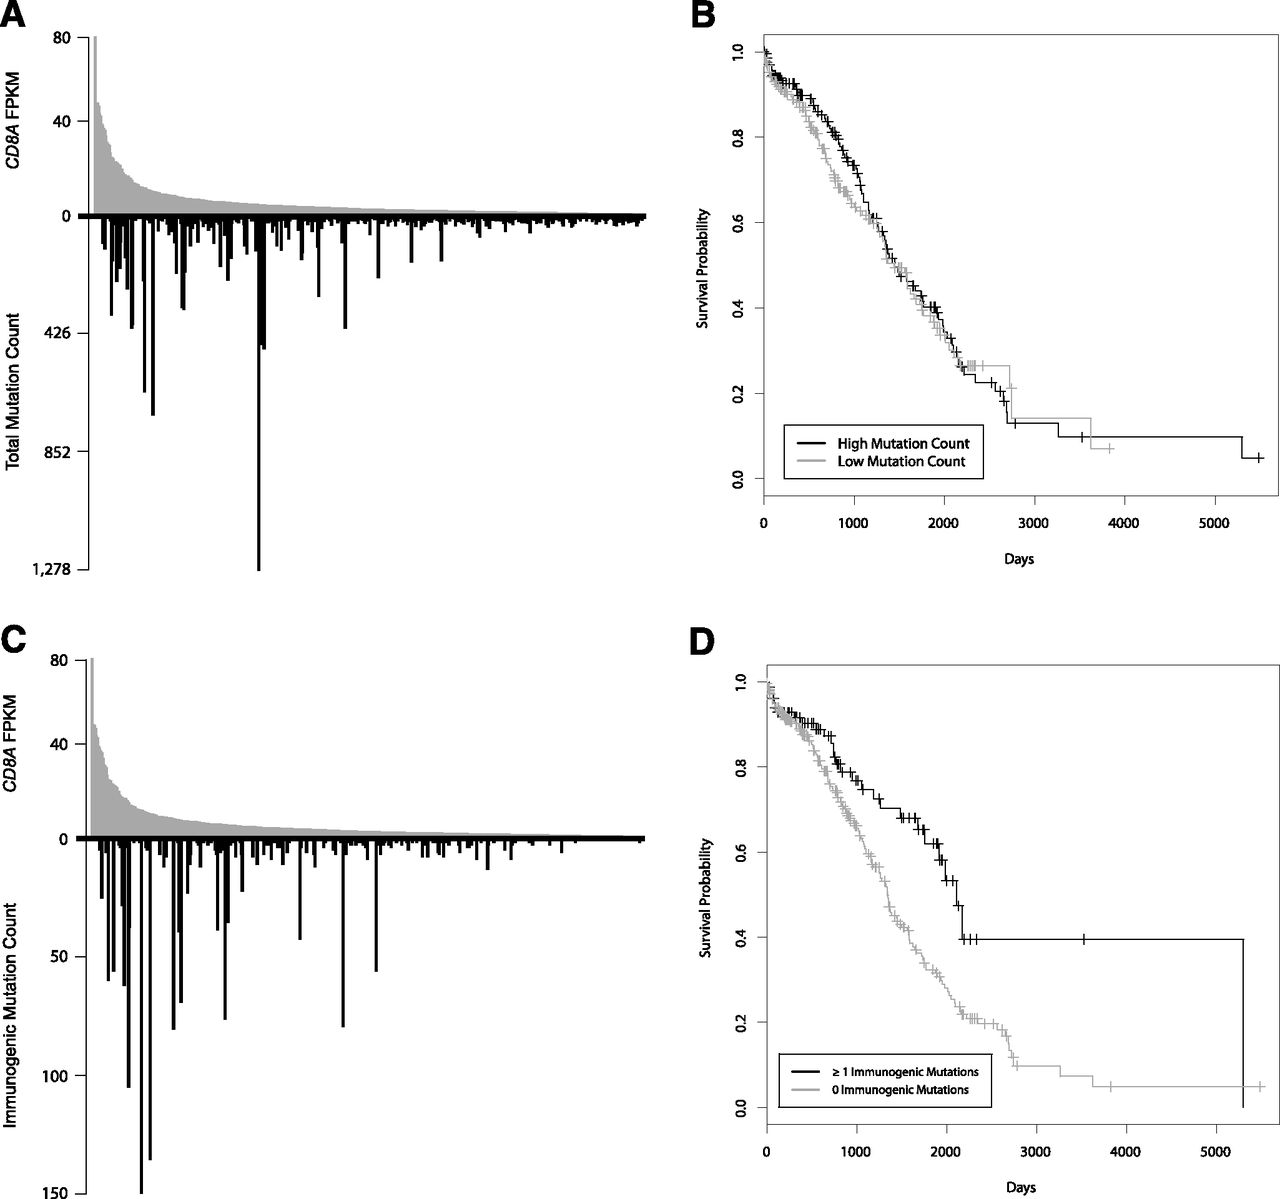
The total number of mutations in tumors is not associated with survival, while the number of predicted immunogenic mutations is associated with survival. (A,C) A “skew plot” was made for all patients (n = 515), ordering patients along the x-axis according to their CD8A expression. Each patient’s CD8A expression was plotted above the x-axis, and total mutation count (A) or predicted immunogenic mutation count (C) was plotted below the x-axis. 73.6% of the total mutation count belonged to patients with above median CD8A expression (P = 2.0 × 10⁻⁶), and 84.7% of the total predicted immunogenic mutation count belonged to patients with above median CD8A expression (P = 1.0 × 10⁻⁶). (B,D) Kaplan-Meier curves were constructed to look at the difference in survival between patients with low versus high numbers of mutations. Patients (n = 468) were split into two groups based on the median mutation count. There was no difference in survival between the two groups when stratifying on total mutation count (B) (HR = 0.91, 95% CI = 0.68 to 1.23, P = 5.5 × 10⁻¹), but there was a statistically significant difference between the two groups when stratifying on predicted immunogenic mutation count (D) (HR = 0.53, 95% CI = 0.36 to 0.80, P = 2.1 × 10⁻³). Tick marks on the Kaplan-Meier graphs denote the last time survival status was known for living patients.