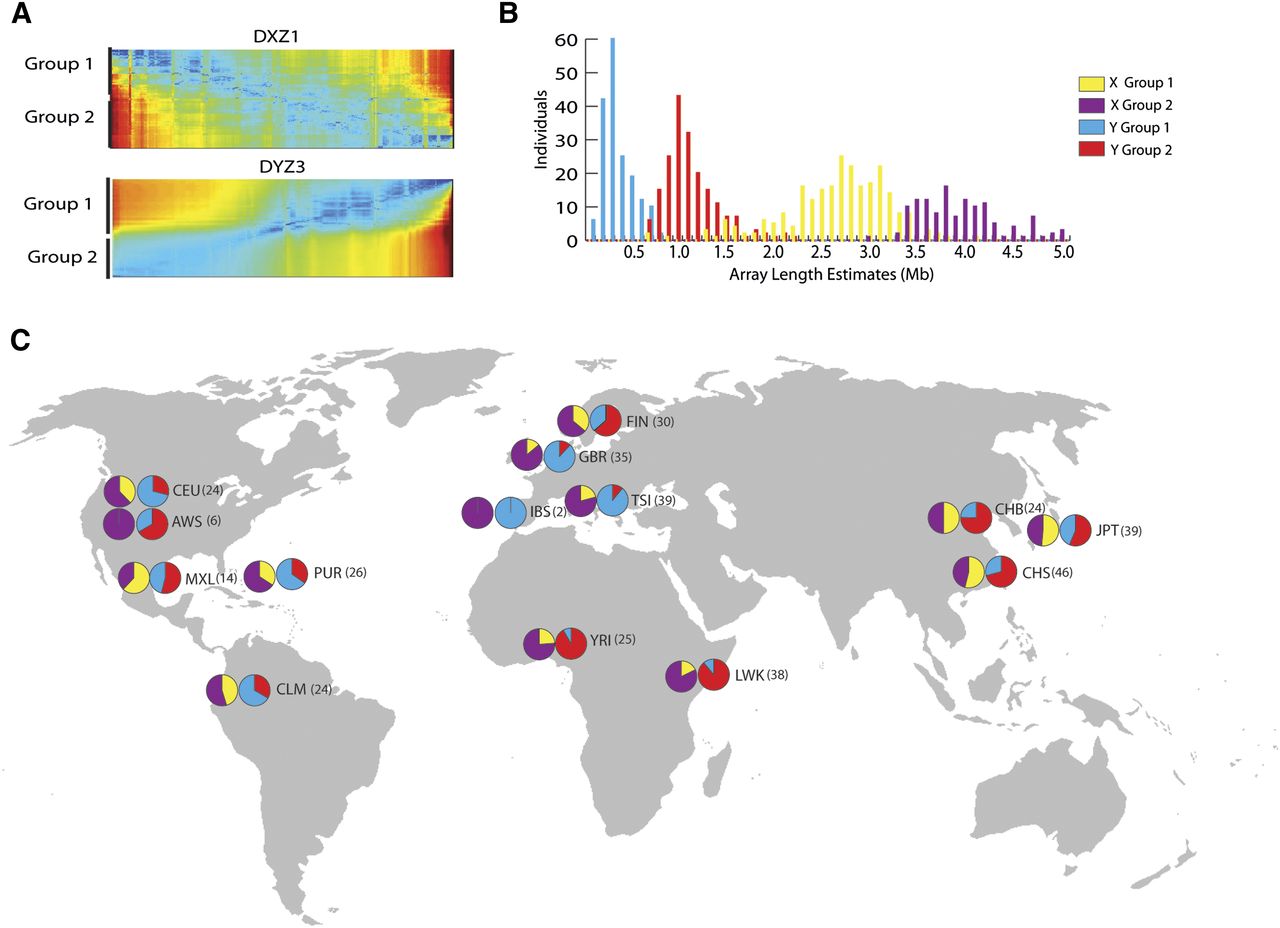
Figure 4.
Assessment of array variation in the human population. (A) Hierarchical clustering and heatmap representation of affinity matrices for array-specific 24-mer frequencies across the X and Y centromeres provide evidence for two array groups (1 and 2). (B) Classification labels from spectral clustering of array 24-mer profiles for each individual array demonstrate a bimodal distribution with observed array size (DYZ3 group 1 in blue, group 2 in red; DXZ1 group 1 in yellow, group 2 in purple). Population-based labels assign array groups to particular geographic locations (C).